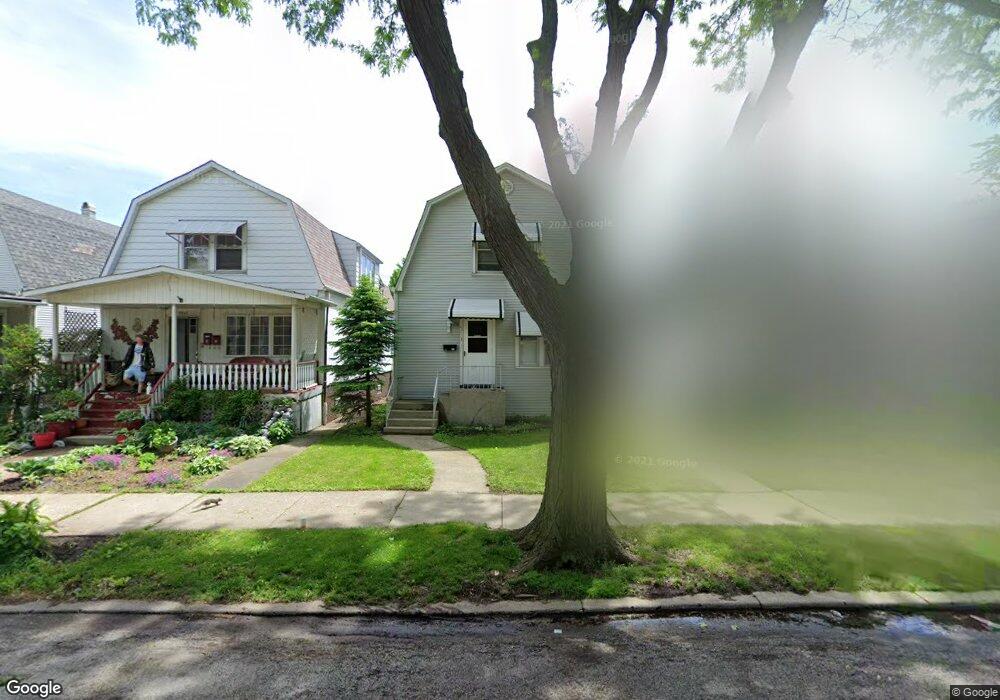
5713 N Austin Ave Chicago, IL 60646
Jefferson Park NeighborhoodEstimated Value: $421,000 - $516,398
4
Beds
3
Baths
3,000
Sq Ft
$155/Sq Ft
Est. Value
About This Home
This home is located at 5713 N Austin Ave, Chicago, IL 60646 and is currently estimated at $464,100, approximately $154 per square foot. 5713 N Austin Ave is a home located in Cook County with nearby schools including Hitch Elementary School, William Howard Taft High School, and St. Constance School.
Ownership History
Date
Name
Owned For
Owner Type
Purchase Details
Closed on
Dec 5, 2017
Sold by
Griffin Laura
Bought by
Boskovic Miljan and Boskovic Mikan
Current Estimated Value
Home Financials for this Owner
Home Financials are based on the most recent Mortgage that was taken out on this home.
Original Mortgage
$237,500
Outstanding Balance
$201,534
Interest Rate
4.25%
Mortgage Type
New Conventional
Estimated Equity
$262,566
Purchase Details
Closed on
Sep 5, 2002
Sold by
Chappell David K and Chappell Michelle J
Bought by
Molenda Leonard J
Home Financials for this Owner
Home Financials are based on the most recent Mortgage that was taken out on this home.
Original Mortgage
$248,800
Interest Rate
6.54%
Purchase Details
Closed on
Jun 13, 2002
Sold by
Chappell Charlene S and Chappell David K
Bought by
Chappell David K and Chappell Michelle J
Create a Home Valuation Report for This Property
The Home Valuation Report is an in-depth analysis detailing your home's value as well as a comparison with similar homes in the area
Home Values in the Area
Average Home Value in this Area
Purchase History
| Date | Buyer | Sale Price | Title Company |
|---|---|---|---|
| Boskovic Miljan | $250,000 | Attorneys Title Guaranty Fun | |
| Molenda Leonard J | $250,000 | First American Title | |
| Griffin Laura | $311,000 | First American Title | |
| Chappell David K | -- | -- |
Source: Public Records
Mortgage History
| Date | Status | Borrower | Loan Amount |
|---|---|---|---|
| Open | Boskovic Miljan | $237,500 | |
| Previous Owner | Griffin Laura | $248,800 | |
| Previous Owner | Molenda Leonard J | $100,000 | |
| Closed | Griffin Laura | $62,200 |
Source: Public Records
Tax History Compared to Growth
Tax History
| Year | Tax Paid | Tax Assessment Tax Assessment Total Assessment is a certain percentage of the fair market value that is determined by local assessors to be the total taxable value of land and additions on the property. | Land | Improvement |
|---|---|---|---|---|
| 2024 | $5,634 | $40,000 | $9,300 | $30,700 |
| 2023 | $5,471 | $30,000 | $7,440 | $22,560 |
| 2022 | $5,471 | $30,000 | $7,440 | $22,560 |
| 2021 | $5,367 | $30,003 | $7,443 | $22,560 |
| 2020 | $5,633 | $28,374 | $5,022 | $23,352 |
| 2019 | $5,648 | $31,527 | $5,022 | $26,505 |
| 2018 | $6,231 | $31,527 | $5,022 | $26,505 |
| 2017 | $4,906 | $26,151 | $4,464 | $21,687 |
| 2016 | $4,740 | $26,151 | $4,464 | $21,687 |
| 2015 | $4,314 | $26,151 | $4,464 | $21,687 |
| 2014 | $4,225 | $25,325 | $4,092 | $21,233 |
| 2013 | $4,131 | $25,325 | $4,092 | $21,233 |
Source: Public Records
Map
Nearby Homes
- 5757 N Mason Ave
- 5706 N Moody Ave
- 5841 N Medina Ave
- 5906 N Mason Ave
- 5600 N Mango Ave
- 5956 N Elston Ave
- 5620 N Major Ave
- 5859 N Melvina Ave
- 5774 N Elston Ave
- 5860 N Melvina Ave
- 5423 N Moody Ave
- 5700 N Parkside Ave
- 5523 N Major Ave
- 5657 N Parkside Ave
- 5700 N Central Ave
- 6011 N Monitor Ave
- 5626 N Central Ave
- 5311 N Mcvicker Ave
- 6035 N Mason Ave
- 5722 N Leonard Ave
- 5711 N Austin Ave
- 5717 N Austin Ave
- 5719 N Austin Ave
- 5707 N Austin Ave
- 5723 N Austin Ave Unit 1
- 5723 N Austin Ave
- 5705 N Austin Ave
- 5725 N Austin Ave
- 5725 N Austin Ave Unit 2
- 5701 N Austin Ave
- 5714 N Mason Ave
- 5710 N Mason Ave
- 5716 N Mason Ave
- 5706 N Mason Ave
- 5729 N Austin Ave
- 5720 N Mason Ave
- 5704 N Mason Ave
- 5700 N Mason Ave
- 5710 N Austin Ave
- 5718 N Austin Ave