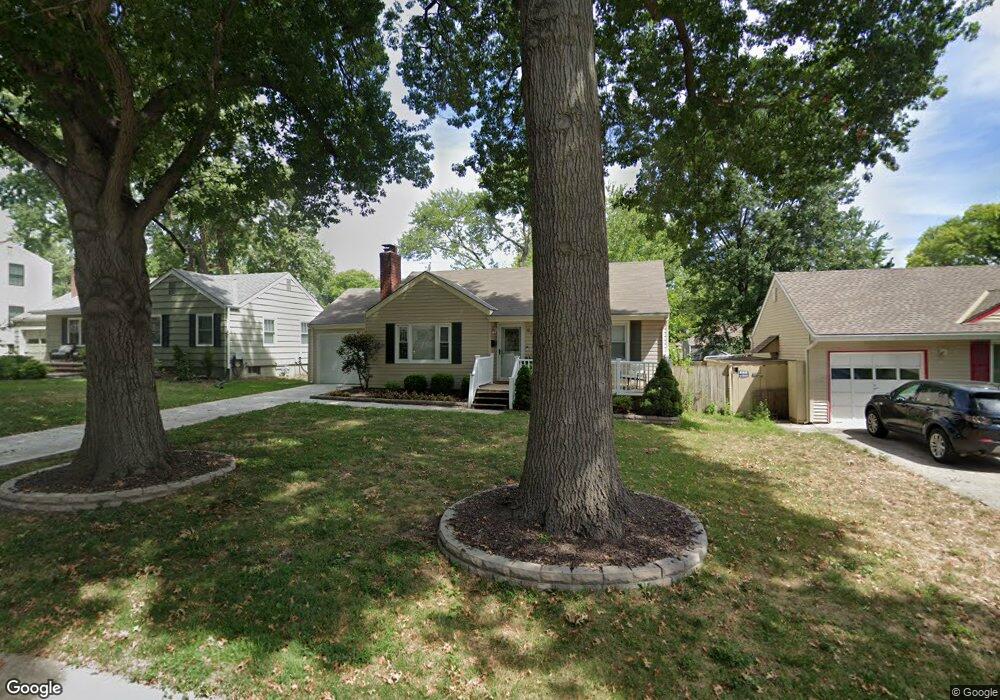
5719 Dearborn St Mission, KS 66202
Estimated Value: $289,000 - $315,000
2
Beds
1
Bath
896
Sq Ft
$338/Sq Ft
Est. Value
About This Home
This home is located at 5719 Dearborn St, Mission, KS 66202 and is currently estimated at $302,925, approximately $338 per square foot. 5719 Dearborn St is a home located in Johnson County with nearby schools including Rushton Elementary School, Hocker Grove Middle School, and Shawnee Mission North High School.
Ownership History
Date
Name
Owned For
Owner Type
Purchase Details
Closed on
Oct 1, 2009
Sold by
Anderson Kristin E
Bought by
Rybicki Stephanie
Current Estimated Value
Home Financials for this Owner
Home Financials are based on the most recent Mortgage that was taken out on this home.
Original Mortgage
$144,337
Outstanding Balance
$94,634
Interest Rate
5.16%
Mortgage Type
FHA
Estimated Equity
$208,291
Purchase Details
Closed on
Apr 22, 2004
Sold by
National Residential Nominee Services In
Bought by
Anderson Kristin E
Home Financials for this Owner
Home Financials are based on the most recent Mortgage that was taken out on this home.
Original Mortgage
$105,200
Interest Rate
5.81%
Mortgage Type
Purchase Money Mortgage
Purchase Details
Closed on
Mar 25, 2004
Sold by
Sherman David L
Bought by
National Residential Nominee Services In
Home Financials for this Owner
Home Financials are based on the most recent Mortgage that was taken out on this home.
Original Mortgage
$105,200
Interest Rate
5.81%
Mortgage Type
Purchase Money Mortgage
Create a Home Valuation Report for This Property
The Home Valuation Report is an in-depth analysis detailing your home's value as well as a comparison with similar homes in the area
Home Values in the Area
Average Home Value in this Area
Purchase History
| Date | Buyer | Sale Price | Title Company |
|---|---|---|---|
| Rybicki Stephanie | -- | Cbkc Title & Escrow Llc | |
| Anderson Kristin E | -- | Chicago Title Ins Co | |
| National Residential Nominee Services In | -- | Chicago Title Ins Co |
Source: Public Records
Mortgage History
| Date | Status | Borrower | Loan Amount |
|---|---|---|---|
| Open | Rybicki Stephanie | $144,337 | |
| Previous Owner | Anderson Kristin E | $105,200 | |
| Closed | Anderson Kristin E | $26,300 |
Source: Public Records
Tax History Compared to Growth
Tax History
| Year | Tax Paid | Tax Assessment Tax Assessment Total Assessment is a certain percentage of the fair market value that is determined by local assessors to be the total taxable value of land and additions on the property. | Land | Improvement |
|---|---|---|---|---|
| 2024 | $4,578 | $37,157 | $7,996 | $29,161 |
| 2023 | $4,138 | $32,706 | $7,266 | $25,440 |
| 2022 | $3,955 | $31,705 | $6,603 | $25,102 |
| 2021 | $3,637 | $27,427 | $5,507 | $21,920 |
| 2020 | $3,442 | $25,346 | $4,789 | $20,557 |
| 2019 | $3,210 | $23,322 | $3,198 | $20,124 |
| 2018 | $3,137 | $22,482 | $3,198 | $19,284 |
| 2017 | $2,790 | $19,308 | $3,198 | $16,110 |
| 2016 | $2,678 | $18,193 | $3,198 | $14,995 |
| 2015 | $2,582 | $17,503 | $3,198 | $14,305 |
| 2013 | -- | $16,410 | $3,198 | $13,212 |
Source: Public Records
Map
Nearby Homes
- 5729 Dearborn St
- 5701 Russell St
- 5431 Woodson Rd
- 5434 Maple St
- 6000 Maple St
- 5940 Nall Ave
- 6620 W 56th St
- 5335 Maple St
- 5504 Glenwood St
- 5343 Rosewood St
- 6108 W 62nd Terrace
- 6130 Riggs Rd
- 6407 W 62nd St
- 5217 Walmer St
- 6301 Woodson Dr
- 6234 Ash St
- 6611 Florence St
- 5600 Roe Blvd
- 6615 Florence St
- 6241 Rosewood Ct
- 5711 Dearborn St
- 5725 Dearborn St
- 5716 Woodson Rd
- 5720 Woodson Rd
- 5710 Woodson Rd
- 5707 Dearborn St
- 5718 Dearborn St
- 5724 Woodson Rd
- 5706 Woodson Rd
- 5724 Dearborn St
- 5712 Dearborn St
- 5907 W 57th St
- 5733 Dearborn St
- 5706 Dearborn St
- 5901 W 57th St
- 5732 Dearborn St
- 6001 W 57th St
- 5737 Dearborn St
- 5717 Beverly Ave
- 5723 Beverly Ave