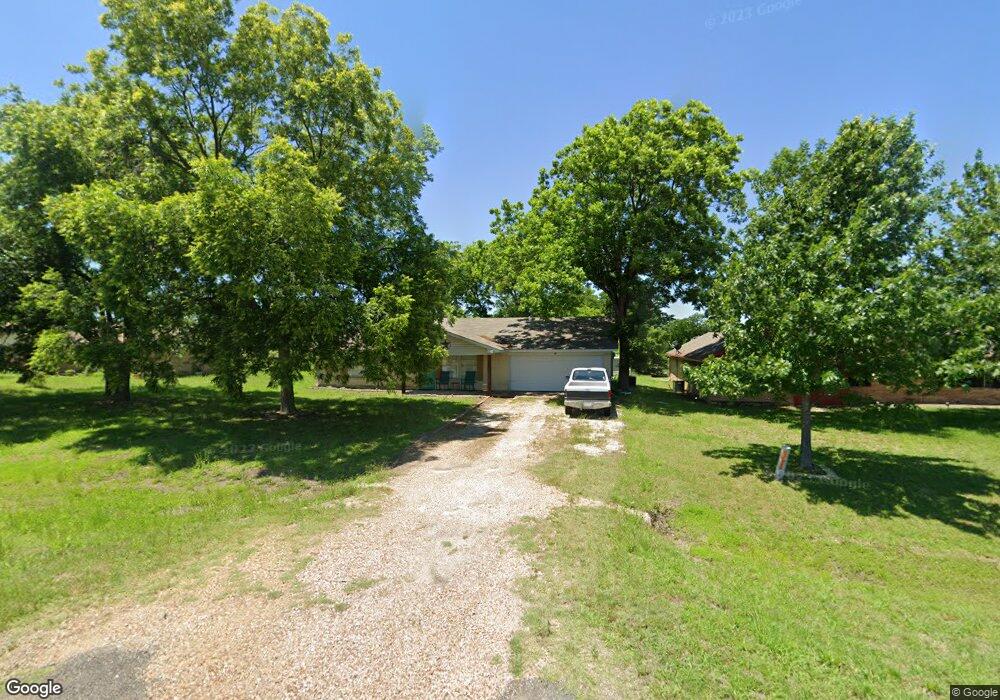
5724 S Interstate Highway 45 W Corsicana, TX 75109
Estimated Value: $291,974 - $358,000
3
Beds
2
Baths
1,862
Sq Ft
$174/Sq Ft
Est. Value
About This Home
This home is located at 5724 S Interstate Highway 45 W, Corsicana, TX 75109 and is currently estimated at $323,244, approximately $173 per square foot. 5724 S Interstate Highway 45 W is a home located in Navarro County with nearby schools including Corsicana High School.
Ownership History
Date
Name
Owned For
Owner Type
Purchase Details
Closed on
Oct 23, 2020
Sold by
Premier Investar Llc
Bought by
Bloyed Sumer A and Coulston William T
Current Estimated Value
Home Financials for this Owner
Home Financials are based on the most recent Mortgage that was taken out on this home.
Original Mortgage
$196,278
Outstanding Balance
$174,261
Interest Rate
2.8%
Mortgage Type
FHA
Estimated Equity
$148,983
Purchase Details
Closed on
Mar 25, 2020
Sold by
Dillon Angela
Bought by
Premier Investar Llc
Home Financials for this Owner
Home Financials are based on the most recent Mortgage that was taken out on this home.
Original Mortgage
$120,000
Interest Rate
3.4%
Mortgage Type
New Conventional
Purchase Details
Closed on
Sep 8, 2019
Sold by
Bamburg Billy R
Bought by
Dillon Angela
Create a Home Valuation Report for This Property
The Home Valuation Report is an in-depth analysis detailing your home's value as well as a comparison with similar homes in the area
Home Values in the Area
Average Home Value in this Area
Purchase History
| Date | Buyer | Sale Price | Title Company |
|---|---|---|---|
| Bloyed Sumer A | -- | Capital Title | |
| Premier Investar Llc | -- | None Available | |
| Dillon Angela | -- | None Available |
Source: Public Records
Mortgage History
| Date | Status | Borrower | Loan Amount |
|---|---|---|---|
| Open | Bloyed Sumer A | $196,278 | |
| Previous Owner | Premier Investar Llc | $120,000 |
Source: Public Records
Tax History Compared to Growth
Tax History
| Year | Tax Paid | Tax Assessment Tax Assessment Total Assessment is a certain percentage of the fair market value that is determined by local assessors to be the total taxable value of land and additions on the property. | Land | Improvement |
|---|---|---|---|---|
| 2025 | $4,134 | $295,529 | $26,910 | $292,410 |
| 2024 | $3,758 | $268,663 | $20,480 | $304,590 |
| 2023 | $3,057 | $244,239 | $25,480 | $250,460 |
| 2022 | $3,967 | $231,190 | $12,750 | $218,440 |
| 2021 | $4,012 | $201,850 | $12,750 | $189,100 |
| 2020 | $2,275 | $112,260 | $12,750 | $99,510 |
| 2019 | $2,121 | $100,100 | $12,750 | $87,350 |
| 2018 | $1,986 | $93,730 | $6,380 | $87,350 |
| 2017 | $1,936 | $91,490 | $6,380 | $85,110 |
| 2016 | $2,371 | $112,050 | $6,380 | $105,670 |
| 2015 | -- | $84,440 | $6,380 | $78,060 |
| 2014 | -- | $84,440 | $6,380 | $78,060 |
Source: Public Records
Map
Nearby Homes
- 320 Birdwell Rd
- 3334 Knight St
- 2161 SW County Road 0025
- 2170 SW County Rd
- 3040 SW County Rd
- 3135 SW County Rd
- 3160 SW County Rd
- 3077 SW County Road 0018
- 4027 SW County Rd
- Lot 5-R4 SW County Rd
- 21 SW County Rd
- 3024 SW County Road 0010
- 3090 SW County Rd
- 3090 SW County Road 0018
- 313 Martin Rd
- 6891 SW County Road 0021
- Tract 1R & 2R Farm To Market 637
- TBD US Hwy 287 and Fm 637
- Lot 17 Grison Cir
- TBD Interstate 45
- 5722 S Interstate Highway 45 W
- 5726 S Interstate Highway 45 W
- 5720 S Interstate Highway 45 W
- 5720 S Interstate Highway 45 W
- 5730 S Interstate Highway 45 W
- 117 Buchanan Blvd
- 5732 S Interstate Highway 45 W
- 116 Buchanan Blvd
- 301 Birdwell Rd
- 307 Birdwell Rd
- 114 Buchanan Blvd
- 217 Birdwell Rd
- 5734 S Interstate Highway 45 W
- 215 Birdwell Rd
- 112 Buchanan Blvd
- 5736 S Interstate Highway 45 W
- 5731 S Interstate Highway 45 E
- 213 Birdwell Rd
- 311 Birdwell Rd
- 110 Buchanan Blvd