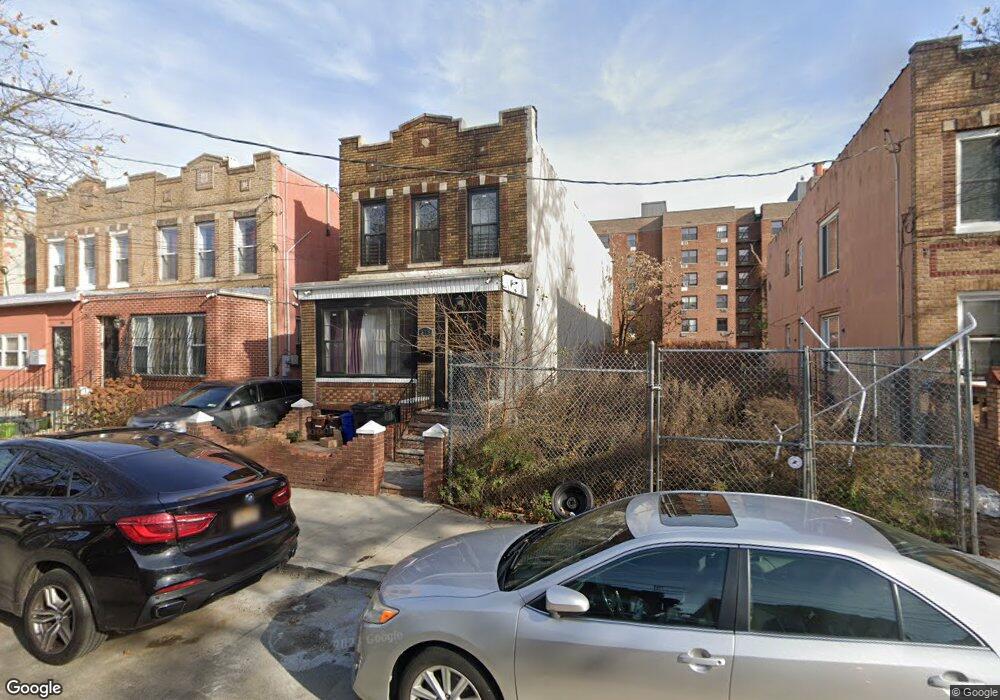
575 Osborn St Unit 2 Brooklyn, NY 11212
Brownsville NeighborhoodEstimated Value: $730,898 - $959,000
3
Beds
2
Baths
2,016
Sq Ft
$420/Sq Ft
Est. Value
About This Home
This home is located at 575 Osborn St Unit 2, Brooklyn, NY 11212 and is currently estimated at $846,725, approximately $420 per square foot. 575 Osborn St Unit 2 is a home located in Kings County with nearby schools including P.S. 165 Ida Posner, P.S. 150 - Christopher, and P.S. 156 Waverly.
Ownership History
Date
Name
Owned For
Owner Type
Purchase Details
Closed on
Apr 5, 2016
Sold by
Pssr Management Llc
Bought by
Vieira Jasmaine O
Current Estimated Value
Home Financials for this Owner
Home Financials are based on the most recent Mortgage that was taken out on this home.
Original Mortgage
$512,000
Outstanding Balance
$404,542
Interest Rate
3.68%
Mortgage Type
New Conventional
Estimated Equity
$442,183
Purchase Details
Closed on
Dec 7, 2015
Sold by
Isabell Elizabeth and Isabell William
Bought by
Pssr Management Llc
Home Financials for this Owner
Home Financials are based on the most recent Mortgage that was taken out on this home.
Original Mortgage
$350,000
Interest Rate
3.97%
Mortgage Type
New Conventional
Purchase Details
Closed on
May 14, 2004
Sold by
Isabell William
Bought by
Isabell Elizabeth and Isabell William
Purchase Details
Closed on
Nov 1, 1993
Sold by
Danner Janet
Bought by
Isabell William
Create a Home Valuation Report for This Property
The Home Valuation Report is an in-depth analysis detailing your home's value as well as a comparison with similar homes in the area
Home Values in the Area
Average Home Value in this Area
Purchase History
| Date | Buyer | Sale Price | Title Company |
|---|---|---|---|
| Vieira Jasmaine O | $640,000 | -- | |
| Vieira Jasmaine O | $640,000 | -- | |
| Pssr Management Llc | $249,000 | -- | |
| Pssr Management Llc | $249,000 | -- | |
| Isabell Elizabeth | -- | -- | |
| Isabell Elizabeth | -- | -- | |
| Isabell William | -- | First American Title Ins Co | |
| Isabell William | -- | First American Title Ins Co |
Source: Public Records
Mortgage History
| Date | Status | Borrower | Loan Amount |
|---|---|---|---|
| Open | Vieira Jasmaine O | $512,000 | |
| Closed | Vieira Jasmaine O | $512,000 | |
| Previous Owner | Pssr Management Llc | $350,000 | |
| Closed | Isabell Elizabeth | $0 |
Source: Public Records
Tax History Compared to Growth
Tax History
| Year | Tax Paid | Tax Assessment Tax Assessment Total Assessment is a certain percentage of the fair market value that is determined by local assessors to be the total taxable value of land and additions on the property. | Land | Improvement |
|---|---|---|---|---|
| 2025 | $2,762 | $45,180 | $21,000 | $24,180 |
| 2024 | $2,762 | $53,100 | $21,000 | $32,100 |
| 2023 | $2,648 | $52,980 | $21,000 | $31,980 |
| 2022 | $2,460 | $43,980 | $21,000 | $22,980 |
| 2021 | $2,450 | $43,020 | $21,000 | $22,020 |
| 2020 | $1,218 | $36,540 | $21,000 | $15,540 |
| 2019 | $2,398 | $36,540 | $21,000 | $15,540 |
| 2018 | $2,215 | $10,866 | $7,286 | $3,580 |
| 2017 | $2,093 | $10,268 | $6,294 | $3,974 |
| 2016 | $1,940 | $9,703 | $6,130 | $3,573 |
| 2015 | $1,168 | $9,703 | $5,655 | $4,048 |
| 2014 | $1,168 | $9,552 | $5,884 | $3,668 |
Source: Public Records
Map
Nearby Homes
- 587 Osborn St
- 504 Thatford Ave
- 258 Lott Ave
- 923 Rockaway Ave
- 632 Osborn St
- 797 Mother Gaston Blvd
- 578 Christopher Ave
- 892 Mother Gaston Blvd
- 555 Christopher Ave
- 664 Osborn St Unit 1
- 124 Lott Ave
- 524 Chester St
- 546 Bristol St
- 699 Sackman St
- 931 Thomas S Boyland St
- 546 Powell St
- 563 Powell St
- 1041 Thomas S Boyland St
- 121 Riverdale Ave
- 1753 Linden Blvd
- 575 Osborn St
- 571 Osborn St
- 569 Osborn St
- 583 Osborn St
- 565 Osborn St
- 585 Osborn St
- 591 Osborn St
- 574 Osborn St
- 593 Osborn St
- 576 Osborn St
- 572 Osborn St
- 580 Osborn St
- 568 Osborn St
- 584 Osborn St
- 566 Osborn St
- 566 Osborn St Unit 2F
- 566 Osborn St Unit 2R
- 566 Osborn St Unit 1F
- 597 Osborn St
- 586 Osborn St