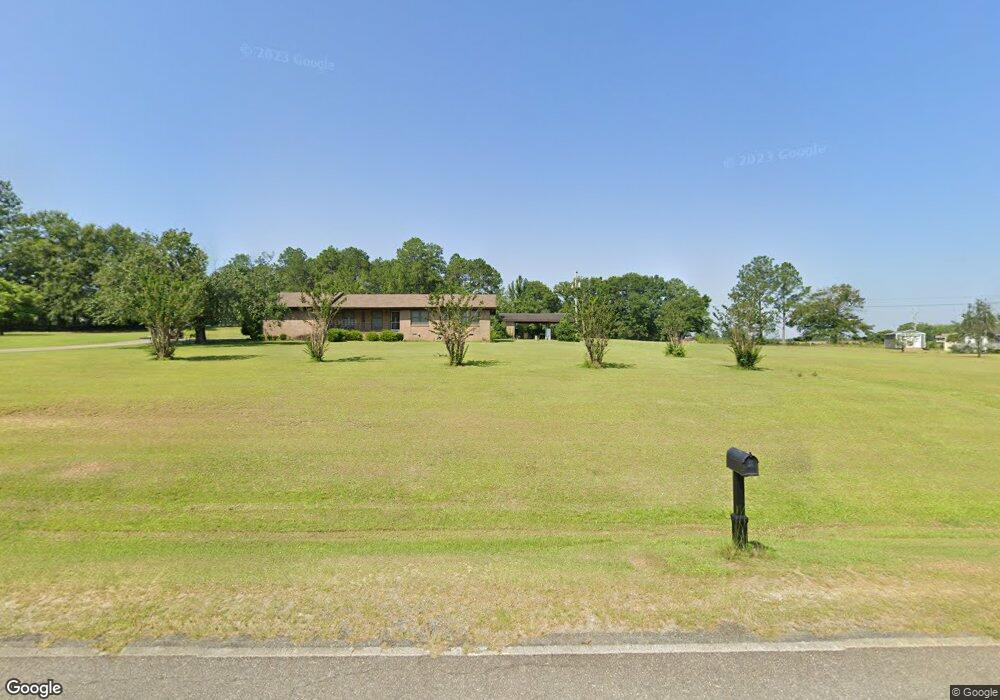
575 Penia Rd N Cordele, GA 31015
Estimated Value: $137,000 - $238,000
3
Beds
2
Baths
1,473
Sq Ft
$120/Sq Ft
Est. Value
About This Home
This home is located at 575 Penia Rd N, Cordele, GA 31015 and is currently estimated at $176,059, approximately $119 per square foot. 575 Penia Rd N is a home located in Crisp County with nearby schools including Crisp County Elementary School, Crisp County Primary School, and Crisp County Middle School.
Ownership History
Date
Name
Owned For
Owner Type
Purchase Details
Closed on
Aug 19, 2003
Sold by
Little Dennis D
Bought by
Yawn Thomas R and Yawn Debbie J
Current Estimated Value
Purchase Details
Closed on
Aug 23, 2001
Sold by
Little Thomas J
Bought by
Little Dennis D
Purchase Details
Closed on
May 18, 1976
Bought by
Little Thomas J
Purchase Details
Closed on
Oct 10, 1975
Bought by
Blizzard Robert G
Create a Home Valuation Report for This Property
The Home Valuation Report is an in-depth analysis detailing your home's value as well as a comparison with similar homes in the area
Home Values in the Area
Average Home Value in this Area
Purchase History
| Date | Buyer | Sale Price | Title Company |
|---|---|---|---|
| Yawn Thomas R | $114,000 | -- | |
| Little Dennis D | -- | -- | |
| Little Thomas J | $15,000 | -- | |
| Blizzard Robert G | $7,500 | -- |
Source: Public Records
Tax History Compared to Growth
Tax History
| Year | Tax Paid | Tax Assessment Tax Assessment Total Assessment is a certain percentage of the fair market value that is determined by local assessors to be the total taxable value of land and additions on the property. | Land | Improvement |
|---|---|---|---|---|
| 2025 | $1,084 | $44,472 | $5,986 | $38,486 |
| 2024 | $1,084 | $42,045 | $5,542 | $36,503 |
| 2023 | $1,094 | $40,966 | $4,993 | $35,973 |
| 2022 | $1,092 | $40,885 | $3,994 | $36,891 |
| 2021 | $1,157 | $39,029 | $3,994 | $35,035 |
| 2020 | $1,100 | $39,029 | $3,994 | $35,035 |
| 2019 | $1,093 | $39,029 | $3,994 | $35,035 |
| 2018 | $1,184 | $40,665 | $3,619 | $37,046 |
| 2017 | $1,251 | $40,665 | $3,619 | $37,046 |
| 2016 | $1,187 | $40,665 | $3,619 | $37,046 |
| 2015 | -- | $40,665 | $3,619 | $37,046 |
| 2014 | -- | $40,665 | $3,619 | $37,046 |
| 2013 | -- | $40,665 | $3,618 | $37,046 |
Source: Public Records
Map
Nearby Homes
- 293 Wildwood Dr
- 0 Old Nesbitt Rd
- 160 Old Nesbitt Rd
- 127 Hill Rd
- 1607 Georgia 257
- 1643 Ga Highway 257
- 1403 Georgia 90
- TBD S Greer St
- 0 S Greer St
- 000 Brady Rd
- 1509 E 20th Ave
- 703 N Pecan St
- 1015 E 8th Ave
- 1009 E Tulip Ave
- 1001 Stewart Ave
- TBD N Pecan St
- Lot #13 Lakeview Dr
- 3041 E Ga Hwy 280
- 1410 E 24th Ave
- 1806 Georgia 90
- 158 Grandview Dr
- 587 Penia Rd N
- 561 Penia Rd N
- 578 Penia Rd N
- 160 Grandview Dr
- 156 Grandview Dr
- 555 Penia Rd N
- 555 Penia Rd N
- 576 Cemetery Rd
- 152 Grandview Dr
- 100 Grandview Place
- 100 Grandview Place Unit 20
- 562 Penia Rd N
- 549 Penia Rd N
- 146 Grandview Dr
- 102 Grandview Place
- 550 Penia Rd N
- 543 Penia Rd N
- 140 Grandview Dr
- 108 Grandview Place