Estimated Value: $745,000 - $891,000
3
Beds
2
Baths
1,716
Sq Ft
$463/Sq Ft
Est. Value
About This Home
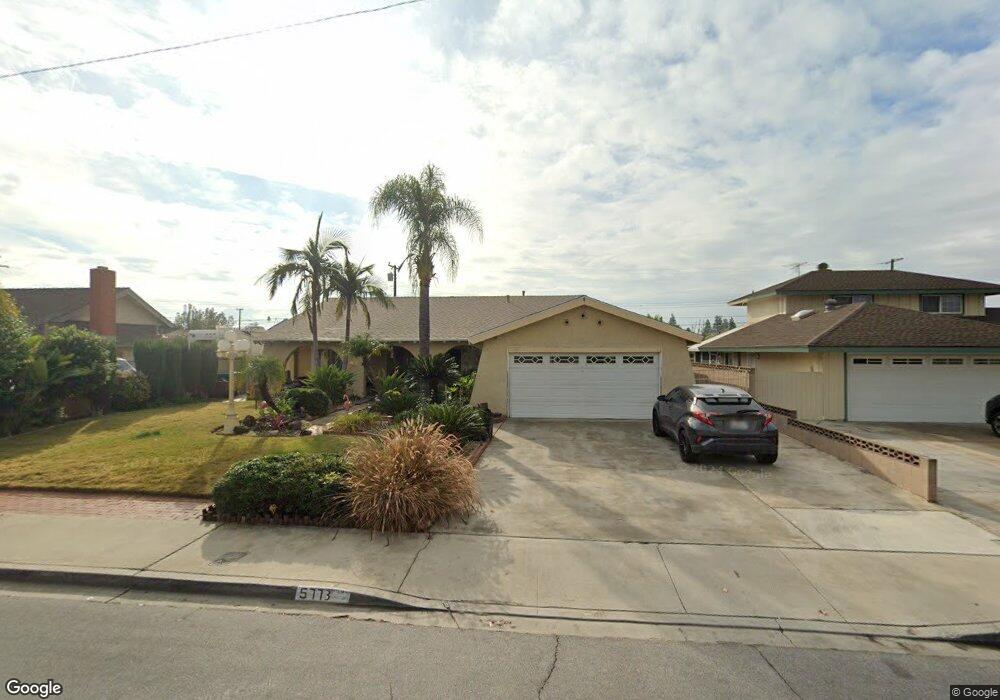
This home is located at 5773 Monticello St, Chino, CA 91710 and is currently estimated at $794,785, approximately $463 per square foot. 5773 Monticello St is a home located in San Bernardino County with nearby schools including E. J. Marshall Elementary, Magnolia Junior High, and Chino High School.
Ownership History
Date
Name
Owned For
Owner Type
Purchase Details
Closed on
May 5, 2009
Sold by
Mejia Armando and Mejia Maria D
Bought by
Federal National Mortgage Association
Current Estimated Value
Purchase Details
Closed on
Feb 21, 2001
Sold by
Martinez Albert M
Bought by
Mejia Armando and Mejia Maria D
Home Financials for this Owner
Home Financials are based on the most recent Mortgage that was taken out on this home.
Original Mortgage
$176,800
Interest Rate
7.19%
Purchase Details
Closed on
Apr 16, 1999
Sold by
Donaldson John R
Bought by
Martinez Albert M
Home Financials for this Owner
Home Financials are based on the most recent Mortgage that was taken out on this home.
Original Mortgage
$85,000
Interest Rate
6.92%
Purchase Details
Closed on
Apr 8, 1999
Sold by
Chief Special Procedures Branch
Bought by
Donaldson John
Home Financials for this Owner
Home Financials are based on the most recent Mortgage that was taken out on this home.
Original Mortgage
$85,000
Interest Rate
6.92%
Purchase Details
Closed on
Jan 16, 1995
Sold by
Vasquez Daniel J and Vasquez Diana L
Bought by
Vasquez Cherie D
Create a Home Valuation Report for This Property
The Home Valuation Report is an in-depth analysis detailing your home's value as well as a comparison with similar homes in the area
Home Values in the Area
Average Home Value in this Area
Purchase History
| Date | Buyer | Sale Price | Title Company |
|---|---|---|---|
| Federal National Mortgage Association | $441,919 | First American | |
| Mejia Armando | $208,000 | First American Title | |
| Martinez Albert M | $175,000 | Fidelity National Title Ins | |
| Donaldson John | $61,500 | -- | |
| Vasquez Cherie D | -- | -- |
Source: Public Records
Mortgage History
| Date | Status | Borrower | Loan Amount |
|---|---|---|---|
| Previous Owner | Mejia Armando | $176,800 | |
| Previous Owner | Martinez Albert M | $85,000 |
Source: Public Records
Tax History Compared to Growth
Tax History
| Year | Tax Paid | Tax Assessment Tax Assessment Total Assessment is a certain percentage of the fair market value that is determined by local assessors to be the total taxable value of land and additions on the property. | Land | Improvement |
|---|---|---|---|---|
| 2025 | $3,413 | $313,425 | $109,699 | $203,726 |
| 2024 | $3,413 | $307,279 | $107,548 | $199,731 |
| 2023 | $3,319 | $301,254 | $105,439 | $195,815 |
| 2022 | $3,300 | $295,347 | $103,372 | $191,975 |
| 2021 | $3,876 | $347,392 | $121,348 | $226,044 |
| 2020 | $3,826 | $343,830 | $120,104 | $223,726 |
| 2019 | $3,759 | $337,088 | $117,749 | $219,339 |
| 2018 | $3,677 | $330,478 | $115,440 | $215,038 |
| 2017 | $3,611 | $323,998 | $113,176 | $210,822 |
| 2016 | $3,375 | $317,645 | $110,957 | $206,688 |
| 2015 | $3,307 | $312,873 | $109,290 | $203,583 |
| 2014 | $3,242 | $306,744 | $107,149 | $199,595 |
Source: Public Records
Map
Nearby Homes
- 12351 Twin Gables Dr
- 5610 Guardian Way
- 6016 Harrison St
- 12321 Gardenia Place
- 2321 S Magnolia Ave Unit 6E
- 2064 S Magnolia Ave
- 1162 W Philadelphia St
- 12524 Ross Ave
- 11782 Vernon Ave
- 5500 Francis Ave
- 926 W Philadelphia St Unit 49
- 926 W Philadelphia St Unit R99
- 926 W Philadelphia St Unit 10
- 12796 17th St
- 1726 S Mountain Ave Unit C
- 12811 Oaks Ave
- 1712 S Mountain Ave Unit E
- 5373 Mariner Ln
- 5640 Riverside Dr Unit 119
- 12635 Franklin Ct Unit 8b
- 5783 Monticello St
- 5763 Monticello St
- 5768 Plymouth St
- 5780 Plymouth St
- 5756 Plymouth St
- 5753 Monticello St
- 5793 Monticello St
- 5768 Monticello St
- 12179 Cottonwood Ave
- 5792 Plymouth St
- 5780 Monticello St
- 5756 Monticello St
- 5792 Monticello St
- 5744 Monticello St
- 12156 Cottonwood Ave
- 12168 Cottonwood Ave
- 5769 Philadelphia St
- 5732 Monticello St
- 5773 Plymouth St
- 5783 Philadelphia St