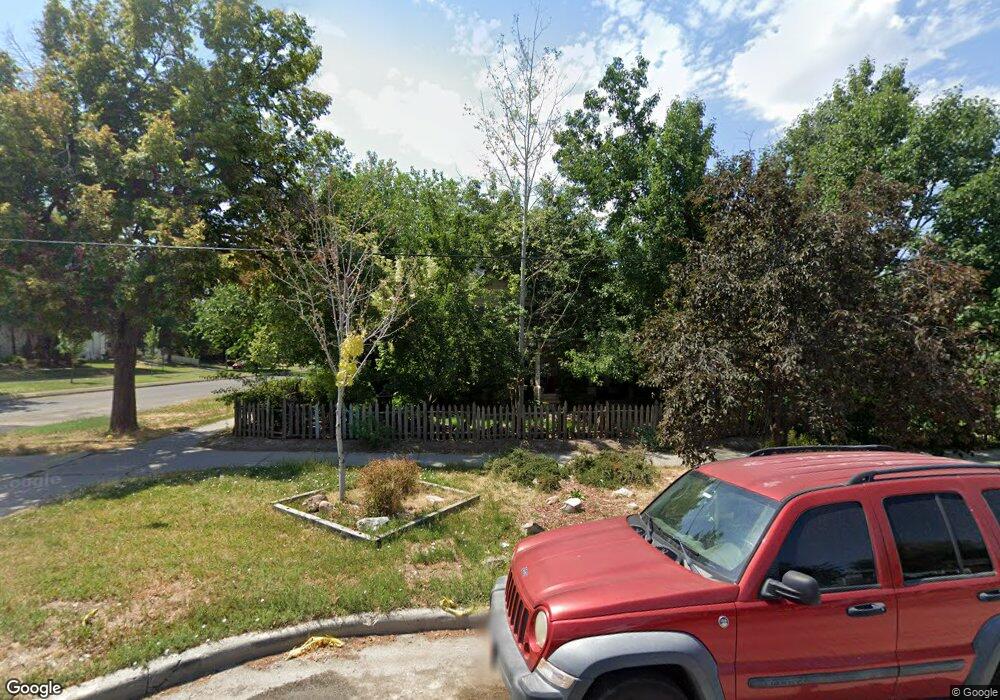
578 E 600 S Salt Lake City, UT 84102
Central City NeighborhoodEstimated Value: $474,718 - $631,000
3
Beds
2
Baths
1,608
Sq Ft
$344/Sq Ft
Est. Value
About This Home
This home is located at 578 E 600 S, Salt Lake City, UT 84102 and is currently estimated at $553,180, approximately $344 per square foot. 578 E 600 S is a home located in Salt Lake County with nearby schools including Bennion Elementary School, Liberty Elementary School, and Highland High School.
Ownership History
Date
Name
Owned For
Owner Type
Purchase Details
Closed on
Feb 8, 1994
Sold by
Salt Lake Community Development Corp
Bought by
City Corp Housing And Economic Developme
Current Estimated Value
Purchase Details
Closed on
May 25, 1993
Sold by
Salt Lake City Corp
Bought by
Romero Ronald T and Romero Terri Lee
Home Financials for this Owner
Home Financials are based on the most recent Mortgage that was taken out on this home.
Original Mortgage
$38,400
Interest Rate
7.19%
Mortgage Type
Seller Take Back
Create a Home Valuation Report for This Property
The Home Valuation Report is an in-depth analysis detailing your home's value as well as a comparison with similar homes in the area
Home Values in the Area
Average Home Value in this Area
Purchase History
| Date | Buyer | Sale Price | Title Company |
|---|---|---|---|
| City Corp Housing And Economic Developme | -- | -- | |
| Romero Ronald T | -- | -- |
Source: Public Records
Mortgage History
| Date | Status | Borrower | Loan Amount |
|---|---|---|---|
| Previous Owner | Romero Ronald T | $38,400 |
Source: Public Records
Tax History Compared to Growth
Tax History
| Year | Tax Paid | Tax Assessment Tax Assessment Total Assessment is a certain percentage of the fair market value that is determined by local assessors to be the total taxable value of land and additions on the property. | Land | Improvement |
|---|---|---|---|---|
| 2025 | $1,362 | $288,700 | $158,800 | $129,900 |
| 2024 | $1,362 | $259,800 | $150,300 | $109,500 |
| 2023 | $1,328 | $244,300 | $144,500 | $99,800 |
| 2022 | $1,395 | $240,700 | $129,700 | $111,000 |
| 2021 | $1,157 | $180,800 | $101,700 | $79,100 |
| 2020 | $1,090 | $162,100 | $91,200 | $70,900 |
| 2019 | $1,127 | $157,700 | $67,300 | $90,400 |
| 2018 | $1,086 | $148,000 | $67,300 | $80,700 |
| 2017 | $1,086 | $138,600 | $67,300 | $71,300 |
| 2016 | $1,045 | $126,700 | $62,400 | $64,300 |
| 2015 | $1,087 | $124,900 | $61,100 | $63,800 |
| 2014 | $1,064 | $121,300 | $63,000 | $58,300 |
Source: Public Records
Map
Nearby Homes
- 624 S 600 E
- 532 E 600 S
- 537 S 500 E Unit 105
- 714 S 600 E
- 745 S 600 E
- 715 Gudgell Ct E
- 509 E 800 S
- 564 E 800 S Unit 566
- 807 S 500 E
- 550 S 400 E Unit 3307
- 804 S 700 E Unit 6
- 339 E 600 S Unit 1111
- 339 E 600 S Unit 1412
- 339 E 600 S Unit 1308
- 339 E 600 S Unit 1201
- 779 S 400 E
- 430 E 800 S
- 333 Stanton Ave
- 742 S 400 E Unit 102
- 717 S 800 E