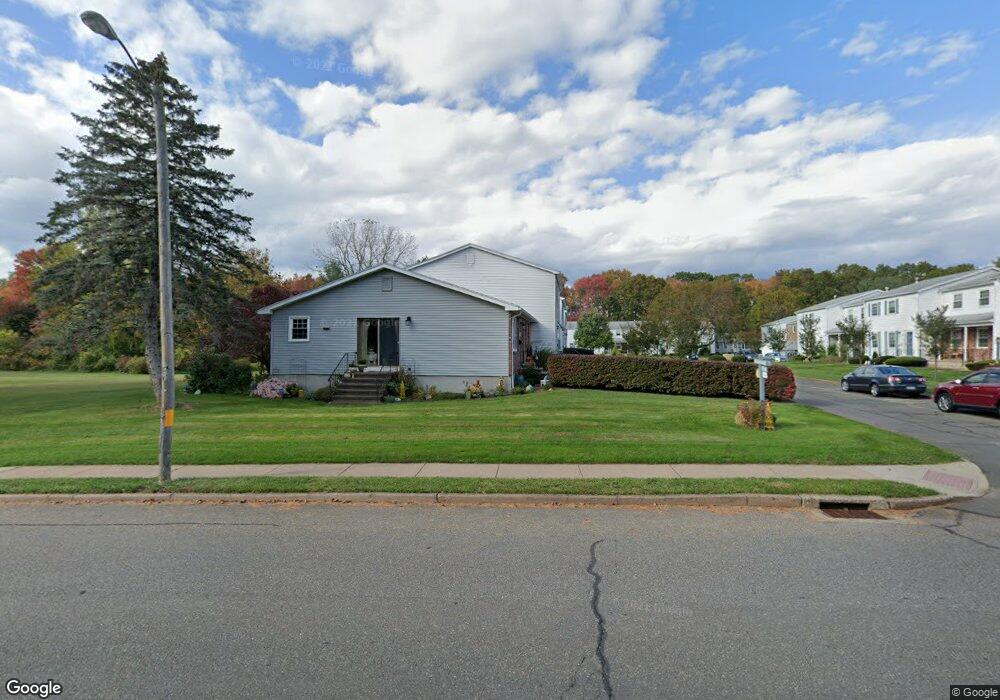
58 Ambassador Dr Unit B Manchester, CT 06042
Buckley District NeighborhoodEstimated Value: $268,158 - $288,000
3
Beds
3
Baths
1,464
Sq Ft
$190/Sq Ft
Est. Value
About This Home
This home is located at 58 Ambassador Dr Unit B, Manchester, CT 06042 and is currently estimated at $278,290, approximately $190 per square foot. 58 Ambassador Dr Unit B is a home located in Hartford County with nearby schools including Buckley School, Illing Middle School, and Elisabeth M. Bennet Academy.
Ownership History
Date
Name
Owned For
Owner Type
Purchase Details
Closed on
Jun 24, 2010
Sold by
Hill Forrest G and Hill Karlene M
Bought by
Vasquez Ducia M
Current Estimated Value
Home Financials for this Owner
Home Financials are based on the most recent Mortgage that was taken out on this home.
Original Mortgage
$176,739
Outstanding Balance
$121,488
Interest Rate
5.5%
Mortgage Type
FHA
Estimated Equity
$156,802
Purchase Details
Closed on
Jun 18, 2007
Sold by
Quish Patrick T and Quish Katharine C
Bought by
Hill Forrest G and Hill Karlene M
Home Financials for this Owner
Home Financials are based on the most recent Mortgage that was taken out on this home.
Original Mortgage
$198,000
Interest Rate
6.19%
Purchase Details
Closed on
Jun 6, 2005
Sold by
Trevison Carl P and Trevison Judy A
Bought by
Quish Patrick T and Brunelle Katharine C
Create a Home Valuation Report for This Property
The Home Valuation Report is an in-depth analysis detailing your home's value as well as a comparison with similar homes in the area
Home Values in the Area
Average Home Value in this Area
Purchase History
| Date | Buyer | Sale Price | Title Company |
|---|---|---|---|
| Vasquez Ducia M | $180,000 | -- | |
| Vasquez Ducia M | $180,000 | -- | |
| Hill Forrest G | $198,000 | -- | |
| Hill Forrest G | $198,000 | -- | |
| Quish Patrick T | $165,000 | -- | |
| Quish Patrick T | $165,000 | -- |
Source: Public Records
Mortgage History
| Date | Status | Borrower | Loan Amount |
|---|---|---|---|
| Open | Quish Patrick T | $176,739 | |
| Closed | Quish Patrick T | $176,739 | |
| Previous Owner | Quish Patrick T | $198,000 |
Source: Public Records
Tax History Compared to Growth
Tax History
| Year | Tax Paid | Tax Assessment Tax Assessment Total Assessment is a certain percentage of the fair market value that is determined by local assessors to be the total taxable value of land and additions on the property. | Land | Improvement |
|---|---|---|---|---|
| 2025 | $4,619 | $116,000 | $0 | $116,000 |
| 2024 | $4,487 | $116,000 | $0 | $116,000 |
| 2023 | $4,315 | $116,000 | $0 | $116,000 |
| 2022 | $4,190 | $116,000 | $0 | $116,000 |
| 2021 | $3,543 | $84,500 | $0 | $84,500 |
| 2020 | $3,538 | $84,500 | $0 | $84,500 |
| 2019 | $3,524 | $84,500 | $0 | $84,500 |
| 2018 | $3,457 | $84,500 | $0 | $84,500 |
| 2017 | $3,359 | $84,500 | $0 | $84,500 |
| 2016 | $4,115 | $103,700 | $0 | $103,700 |
| 2015 | $4,086 | $103,700 | $0 | $103,700 |
| 2014 | $4,008 | $103,700 | $0 | $103,700 |
Source: Public Records
Map
Nearby Homes
- 56 Elizabeth Dr
- 120 Green Manor Rd
- 28 Elizabeth Dr
- 29 Bretton Rd
- 39 Alice Dr
- 70 Weaver Rd
- 600 Lydall St
- 39 W Vernon St
- 210 Green Rd
- 9 Cook St
- 4 Buckingham St
- 213 Oakland St Unit D
- 178 Parker St
- 9 Parsons Ct
- 52 Charis Rd
- 244 Oakland St Unit E
- 244 Oakland St Unit H
- 413 Lady Bug Ln Unit 413
- 68 Deer Run Trail
- 166 Lake St
- 58 Ambassador Dr Unit E
- 58 Ambassador Dr Unit D
- 58 Ambassador Dr Unit C
- 58 Ambassador Dr Unit A
- 73 Ambassador Dr Unit F
- 73 Ambassador Dr Unit E
- 73 Ambassador Dr Unit D
- 73 Ambassador Dr Unit C
- 73 Ambassador Dr Unit A
- 66 Ambassador Dr Unit F
- 66 Ambassador Dr Unit E
- 66 Ambassador Dr Unit D
- 66 Ambassador Dr Unit C
- 66 Ambassador Dr Unit A
- 66 Ambassador Dr
- 65 Ambassador Dr Unit F
- 65 Ambassador Dr Unit E
- 65 Ambassador Dr Unit D
- 65 Ambassador Dr Unit C