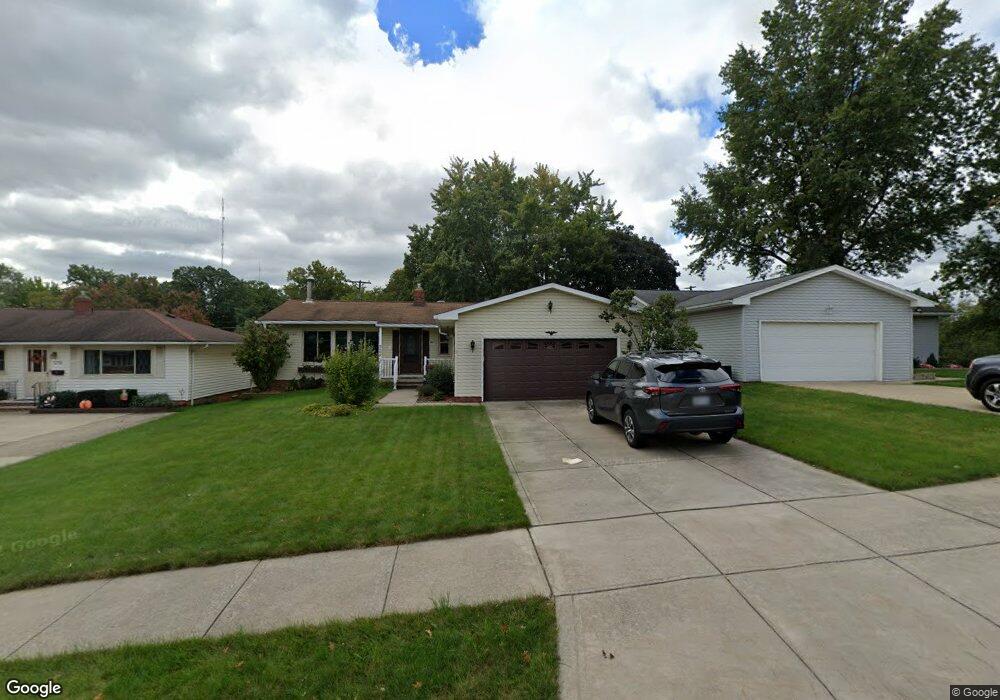
5801 Loyola Dr Cleveland, OH 44129
Estimated Value: $221,000 - $288,000
3
Beds
3
Baths
1,296
Sq Ft
$189/Sq Ft
Est. Value
About This Home
This home is located at 5801 Loyola Dr, Cleveland, OH 44129 and is currently estimated at $245,001, approximately $189 per square foot. 5801 Loyola Dr is a home located in Cuyahoga County with nearby schools including Renwood Elementary School, Hillside Middle School, and Parma High School.
Ownership History
Date
Name
Owned For
Owner Type
Purchase Details
Closed on
Jul 12, 2017
Sold by
Rosalina Joseph K and Golga George J
Bought by
Rosalina Joseph K
Current Estimated Value
Purchase Details
Closed on
May 23, 2011
Sold by
Marshall John F
Bought by
Golga George J and Golga Gail M
Home Financials for this Owner
Home Financials are based on the most recent Mortgage that was taken out on this home.
Original Mortgage
$102,320
Outstanding Balance
$71,369
Interest Rate
4.96%
Mortgage Type
New Conventional
Estimated Equity
$173,632
Purchase Details
Closed on
Nov 27, 1989
Sold by
Kessler Keith D and Kessler Robin L
Bought by
Marshall John F
Purchase Details
Closed on
Sep 20, 1983
Sold by
Kessler Keith D
Bought by
Kessler Keith D and Kessler Robin L
Purchase Details
Closed on
Mar 2, 1981
Sold by
Knuth David C and Knuth Phyllis E
Bought by
Kessler Keith D
Purchase Details
Closed on
Jan 1, 1975
Bought by
Knuth David C and Knuth Phyllis E
Create a Home Valuation Report for This Property
The Home Valuation Report is an in-depth analysis detailing your home's value as well as a comparison with similar homes in the area
Home Values in the Area
Average Home Value in this Area
Purchase History
| Date | Buyer | Sale Price | Title Company |
|---|---|---|---|
| Rosalina Joseph K | -- | None Available | |
| Golga George J | $127,900 | Signature Title | |
| Marshall John F | $98,000 | -- | |
| Kessler Keith D | -- | -- | |
| Kessler Keith D | $56,800 | -- | |
| Knuth David C | -- | -- |
Source: Public Records
Mortgage History
| Date | Status | Borrower | Loan Amount |
|---|---|---|---|
| Open | Golga George J | $102,320 |
Source: Public Records
Tax History Compared to Growth
Tax History
| Year | Tax Paid | Tax Assessment Tax Assessment Total Assessment is a certain percentage of the fair market value that is determined by local assessors to be the total taxable value of land and additions on the property. | Land | Improvement |
|---|---|---|---|---|
| 2024 | $4,082 | $65,380 | $14,560 | $50,820 |
| 2023 | $3,717 | $51,380 | $12,880 | $38,500 |
| 2022 | $3,683 | $51,380 | $12,880 | $38,500 |
| 2021 | $3,793 | $51,380 | $12,880 | $38,500 |
| 2020 | $3,319 | $39,520 | $9,910 | $29,610 |
| 2019 | $3,188 | $112,900 | $28,300 | $84,600 |
| 2018 | $2,998 | $39,520 | $9,910 | $29,610 |
| 2017 | $2,954 | $34,650 | $7,280 | $27,370 |
| 2016 | $2,936 | $34,650 | $7,280 | $27,370 |
| 2015 | $2,832 | $34,650 | $7,280 | $27,370 |
| 2014 | $2,832 | $35,350 | $7,420 | $27,930 |
Source: Public Records
Map
Nearby Homes
- 5700 Hollywood Dr
- 6510 Belmere Dr
- 5211 W Ridgewood Dr
- 6921 Hollywood Dr
- 6431 W Ridgewood Dr
- 6468 State Rd Unit L11
- 5208 Orchard Park Dr
- 5415 Pelham Dr
- 6474 State Rd Unit I-10
- 5205 Woodrow Ave
- 6189 W 54th St
- 4601 W Ridgewood Dr
- 6474 Ridge Rd
- 6298 Chestnut Hills Dr
- 6701 Pelham Dr
- 6480 State Rd Unit F10
- 6234 N Canterbury Rd
- 0 Orchard Park Dr
- 6485 Buckingham Dr
- 6227 Ridge Rd
- 5807 Loyola Dr
- 5755 Loyola Dr
- 5703 Loyola Dr
- 6396 Fordham Dr
- 6400 Fordham Dr
- 5804 Loyola Dr
- 5800 Loyola Dr
- 5810 Loyola Dr
- 5710 Loyola Dr
- 5685 Loyola Dr
- 6404 Fordham Dr
- 5702 Loyola Dr
- 5696 Loyola Dr
- 6408 Fordham Dr
- 6397 Fordham Dr
- 5609 Loyola Dr
- 6403 Fordham Dr
- 5640 Loyola Dr
- 5805 Hollywood Dr
- 5801 Hollywood Dr