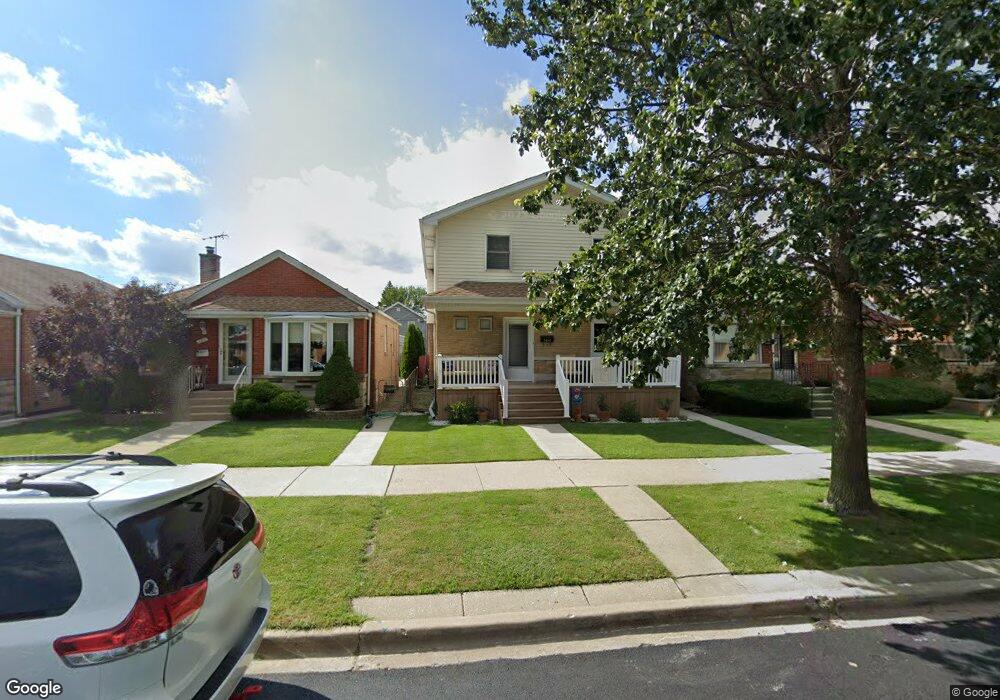
5810 S Neenah Ave Chicago, IL 60638
Garfield Ridge NeighborhoodEstimated Value: $409,000 - $508,000
5
Beds
2
Baths
1,824
Sq Ft
$245/Sq Ft
Est. Value
About This Home
This home is located at 5810 S Neenah Ave, Chicago, IL 60638 and is currently estimated at $447,495, approximately $245 per square foot. 5810 S Neenah Ave is a home located in Cook County with nearby schools including Byrne Elementary School, Kennedy High School, and St Daniel The Prophet School.
Ownership History
Date
Name
Owned For
Owner Type
Purchase Details
Closed on
Aug 21, 2020
Sold by
Dolan John P
Bought by
Lewis Kyle and Lewis Catherine T
Current Estimated Value
Home Financials for this Owner
Home Financials are based on the most recent Mortgage that was taken out on this home.
Original Mortgage
$288,000
Interest Rate
3%
Mortgage Type
New Conventional
Purchase Details
Closed on
Jan 9, 2013
Sold by
Rizzi Leonard M and Rizzi Jacqueline M
Bought by
Dolan John P
Home Financials for this Owner
Home Financials are based on the most recent Mortgage that was taken out on this home.
Original Mortgage
$212,000
Interest Rate
3.62%
Mortgage Type
New Conventional
Purchase Details
Closed on
Sep 19, 1996
Sold by
Florczyk Janusz and Florczyk Ursula
Bought by
Rizzi Leonard M and Rizzi Jacqueline M
Home Financials for this Owner
Home Financials are based on the most recent Mortgage that was taken out on this home.
Original Mortgage
$160,680
Interest Rate
8.14%
Mortgage Type
VA
Create a Home Valuation Report for This Property
The Home Valuation Report is an in-depth analysis detailing your home's value as well as a comparison with similar homes in the area
Home Values in the Area
Average Home Value in this Area
Purchase History
| Date | Buyer | Sale Price | Title Company |
|---|---|---|---|
| Lewis Kyle | $320,000 | Attorney | |
| Dolan John P | -- | Ravenswood Title Company Llc | |
| Rizzi Leonard M | $156,000 | -- |
Source: Public Records
Mortgage History
| Date | Status | Borrower | Loan Amount |
|---|---|---|---|
| Previous Owner | Lewis Kyle | $288,000 | |
| Previous Owner | Dolan John P | $212,000 | |
| Previous Owner | Rizzi Leonard M | $160,680 |
Source: Public Records
Tax History Compared to Growth
Tax History
| Year | Tax Paid | Tax Assessment Tax Assessment Total Assessment is a certain percentage of the fair market value that is determined by local assessors to be the total taxable value of land and additions on the property. | Land | Improvement |
|---|---|---|---|---|
| 2024 | $5,675 | $37,000 | $5,628 | $31,372 |
| 2023 | $5,512 | $30,069 | $5,025 | $25,044 |
| 2022 | $5,512 | $30,069 | $5,025 | $25,044 |
| 2021 | $6,369 | $35,000 | $5,025 | $29,975 |
| 2020 | $4,577 | $23,515 | $4,020 | $19,495 |
| 2019 | $4,590 | $26,128 | $4,020 | $22,108 |
| 2018 | $4,512 | $26,128 | $4,020 | $22,108 |
| 2017 | $4,928 | $26,118 | $3,618 | $22,500 |
| 2016 | $4,762 | $26,118 | $3,618 | $22,500 |
| 2015 | $4,337 | $26,118 | $3,618 | $22,500 |
| 2014 | $4,171 | $24,874 | $3,417 | $21,457 |
| 2013 | $4,560 | $24,874 | $3,417 | $21,457 |
Source: Public Records
Map
Nearby Homes
- 5653 S Normandy Ave
- 5820 S Rutherford Ave
- 6020 S Nashville Ave
- 5823 S Mulligan Ave
- 6031 S Normandy Ave
- 5523 S Neenah Ave
- 5519 S Nashville Ave
- 6104 S Nashville Ave
- 5622 S Oak Park Ave
- 6158 W 60th St Unit 10
- 6206 S Nashville Ave
- 5745 S Sayre Ave
- 6122 W 59th St
- 6046 S Melvina Ave
- 6340 S Archer Ave
- 6004 S Moody Ave
- 5520 S New England Ave
- 5914 S Meade Ave
- 5621 S Moody Ave
- 5727 S Meade Ave
- 5806 S Neenah Ave
- 5812 S Neenah Ave
- 5804 S Neenah Ave
- 5816 S Neenah Ave
- 5800 S Neenah Ave
- 5820 S Neenah Ave
- 5809 S Nashville Ave
- 5813 S Nashville Ave
- 5822 S Neenah Ave
- 5805 S Nashville Ave
- 5817 S Nashville Ave
- 5801 S Nashville Ave
- 5819 S Nashville Ave
- 5826 S Neenah Ave
- 5821 S Nashville Ave
- 5758 S Neenah Ave
- 5811 S Neenah Ave
- 5809 S Neenah Ave
- 5815 S Neenah Ave
- 5805 S Neenah Ave