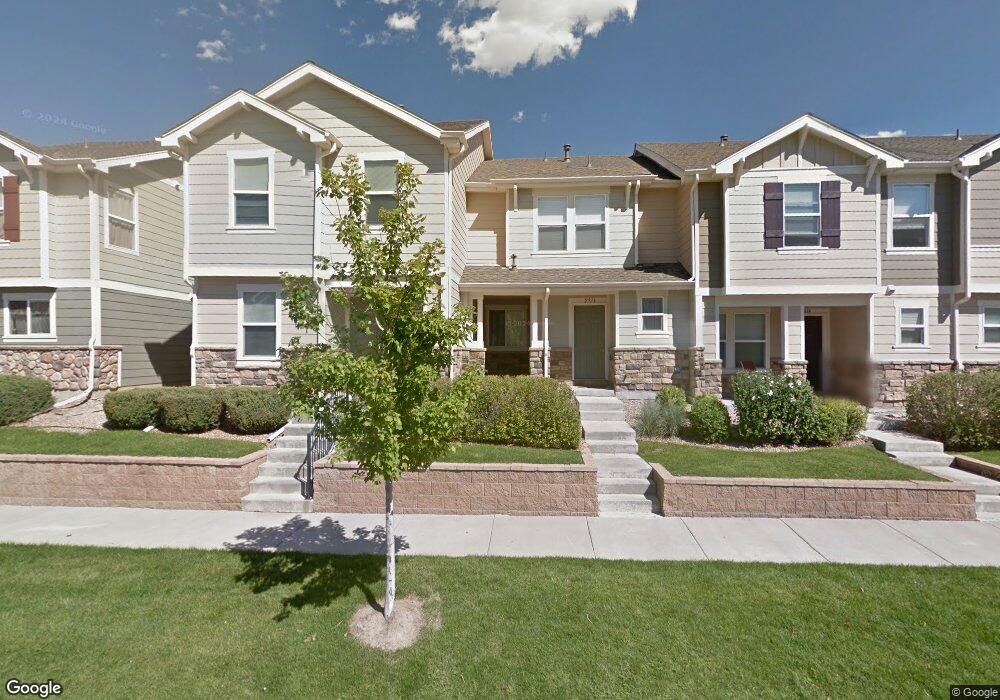
5818 Biscay St Denver, CO 80249
Estimated Value: $384,000 - $407,000
3
Beds
3
Baths
1,583
Sq Ft
$249/Sq Ft
Est. Value
About This Home
This home is located at 5818 Biscay St, Denver, CO 80249 and is currently estimated at $394,400, approximately $249 per square foot. 5818 Biscay St is a home located in Denver County with nearby schools including Pitt-Waller K-8 School, McGlone Academy, and Marie L. Greenwood Academy.
Ownership History
Date
Name
Owned For
Owner Type
Purchase Details
Closed on
Sep 16, 2009
Sold by
Fannie Mae
Bought by
Thorne Vivian R
Current Estimated Value
Home Financials for this Owner
Home Financials are based on the most recent Mortgage that was taken out on this home.
Original Mortgage
$135,500
Outstanding Balance
$89,379
Interest Rate
5.36%
Mortgage Type
FHA
Estimated Equity
$305,021
Purchase Details
Closed on
Aug 18, 2009
Sold by
Ponomarev Mikhail
Bought by
Federal National Mortgage Association
Home Financials for this Owner
Home Financials are based on the most recent Mortgage that was taken out on this home.
Original Mortgage
$135,500
Outstanding Balance
$89,379
Interest Rate
5.36%
Mortgage Type
FHA
Estimated Equity
$305,021
Purchase Details
Closed on
Aug 15, 2006
Sold by
Kb Home Colorado Inc
Bought by
Ponomarev Mikhail
Home Financials for this Owner
Home Financials are based on the most recent Mortgage that was taken out on this home.
Original Mortgage
$159,027
Interest Rate
6.5%
Mortgage Type
New Conventional
Create a Home Valuation Report for This Property
The Home Valuation Report is an in-depth analysis detailing your home's value as well as a comparison with similar homes in the area
Home Values in the Area
Average Home Value in this Area
Purchase History
| Date | Buyer | Sale Price | Title Company |
|---|---|---|---|
| Thorne Vivian R | $138,000 | None Available | |
| Federal National Mortgage Association | -- | None Available | |
| Ponomarev Mikhail | $198,784 | Security Title |
Source: Public Records
Mortgage History
| Date | Status | Borrower | Loan Amount |
|---|---|---|---|
| Open | Thorne Vivian R | $135,500 | |
| Previous Owner | Ponomarev Mikhail | $159,027 |
Source: Public Records
Tax History Compared to Growth
Tax History
| Year | Tax Paid | Tax Assessment Tax Assessment Total Assessment is a certain percentage of the fair market value that is determined by local assessors to be the total taxable value of land and additions on the property. | Land | Improvement |
|---|---|---|---|---|
| 2024 | $2,194 | $23,190 | $2,490 | $20,700 |
| 2023 | $2,168 | $23,190 | $2,490 | $20,700 |
| 2022 | $2,021 | $21,160 | $2,730 | $18,430 |
| 2021 | $2,021 | $21,770 | $2,810 | $18,960 |
| 2020 | $1,826 | $20,240 | $2,810 | $17,430 |
| 2019 | $1,783 | $20,240 | $2,810 | $17,430 |
| 2018 | $1,496 | $16,020 | $2,350 | $13,670 |
| 2017 | $1,492 | $16,020 | $2,350 | $13,670 |
| 2016 | $1,259 | $12,910 | $868 | $12,042 |
| 2015 | $1,215 | $12,910 | $868 | $12,042 |
| 2014 | $913 | $9,220 | $852 | $8,368 |
Source: Public Records
Map
Nearby Homes
- 5798 Biscay St
- 5793 Biscay St
- 5888 Biscay St Unit B
- 5888 Biscay St Unit D
- 18947 E 57th Place
- 19043 E 58th Ave
- 5758 Biscay St
- 18761 E 58th Ave Unit A
- 18717 E 57th Place Unit B
- 9372 Ceylon St
- 18986 E 57th Place Unit A
- 5800 Tower Rd Unit 305
- 5800 Tower Rd Unit 610
- 5800 Tower Rd Unit 505
- 5850 Ceylon St Unit D
- 19047 Randolph Place
- 19155 Robins Dr
- 5568 Ceylon St
- Vyktorea I Plan at Gateway Commons
- Addisyn II-G Plan at Gateway Commons
- 5824 Biscay St
- 5816 Biscay St
- 5814 Biscay St
- 5826 Biscay St
- 5808 Biscay St
- 5828 Biscay St
- 5806 Biscay St
- 5834 Biscay St
- 5804 Biscay St
- 5836 Biscay St
- 5817 Biscay St
- 5815 Biscay St
- 5838 Biscay St
- 5823 Biscay St
- 5813 Biscay St
- 5827 Biscay St
- 5825 Biscay St
- 18923 E 58th Ave
- 5844 Biscay St
- 18921 E 58th Ave