Estimated Value: $322,556 - $334,000
--
Bed
2
Baths
1,868
Sq Ft
$176/Sq Ft
Est. Value
About This Home
This home is located at 5827 Cross Creek Cir, Tyler, TX 75703 and is currently estimated at $327,889, approximately $175 per square foot. 5827 Cross Creek Cir is a home located in Smith County with nearby schools including Rice Elementary School, Hubbard Middle School, and Tyler Legacy High School.
Ownership History
Date
Name
Owned For
Owner Type
Purchase Details
Closed on
Sep 5, 2018
Sold by
Schmutz Van Eric and Schmutz Karen Kelley
Bought by
Starnes Billy J and Starnes Carol L
Current Estimated Value
Home Financials for this Owner
Home Financials are based on the most recent Mortgage that was taken out on this home.
Original Mortgage
$46,500
Outstanding Balance
$40,299
Interest Rate
4.5%
Mortgage Type
Purchase Money Mortgage
Estimated Equity
$287,590
Purchase Details
Closed on
Apr 28, 2016
Sold by
Reynolds Johnie E and Glen Johnie R
Bought by
Schmutz Van Eric and Schmutz Karen Kelley
Home Financials for this Owner
Home Financials are based on the most recent Mortgage that was taken out on this home.
Original Mortgage
$175,500
Interest Rate
3.73%
Mortgage Type
New Conventional
Purchase Details
Closed on
Oct 31, 2006
Sold by
Northstar Realty Ltd
Bought by
Glenn John W and Glenn Johnie R
Create a Home Valuation Report for This Property
The Home Valuation Report is an in-depth analysis detailing your home's value as well as a comparison with similar homes in the area
Home Values in the Area
Average Home Value in this Area
Purchase History
| Date | Buyer | Sale Price | Title Company |
|---|---|---|---|
| Starnes Billy J | -- | None Available | |
| Schmutz Van Eric | -- | None Available | |
| Glenn John W | -- | None Available |
Source: Public Records
Mortgage History
| Date | Status | Borrower | Loan Amount |
|---|---|---|---|
| Open | Starnes Billy J | $46,500 | |
| Previous Owner | Schmutz Van Eric | $175,500 |
Source: Public Records
Tax History Compared to Growth
Tax History
| Year | Tax Paid | Tax Assessment Tax Assessment Total Assessment is a certain percentage of the fair market value that is determined by local assessors to be the total taxable value of land and additions on the property. | Land | Improvement |
|---|---|---|---|---|
| 2025 | $2,235 | $329,552 | $25,494 | $304,058 |
| 2024 | $2,235 | $303,694 | $46,200 | $322,638 |
| 2023 | $4,813 | $327,023 | $46,200 | $280,823 |
| 2022 | $4,917 | $270,099 | $46,200 | $223,899 |
| 2021 | $4,787 | $228,169 | $46,200 | $181,969 |
| 2020 | $4,877 | $230,046 | $46,200 | $183,846 |
| 2019 | $4,531 | $207,199 | $42,000 | $165,199 |
| 2018 | $4,360 | $200,451 | $42,000 | $158,451 |
| 2017 | $4,279 | $200,451 | $42,000 | $158,451 |
| 2016 | $4,316 | $202,169 | $42,000 | $160,169 |
| 2015 | $1,442 | $197,164 | $42,000 | $155,164 |
| 2014 | $1,442 | $192,289 | $42,000 | $150,289 |
Source: Public Records
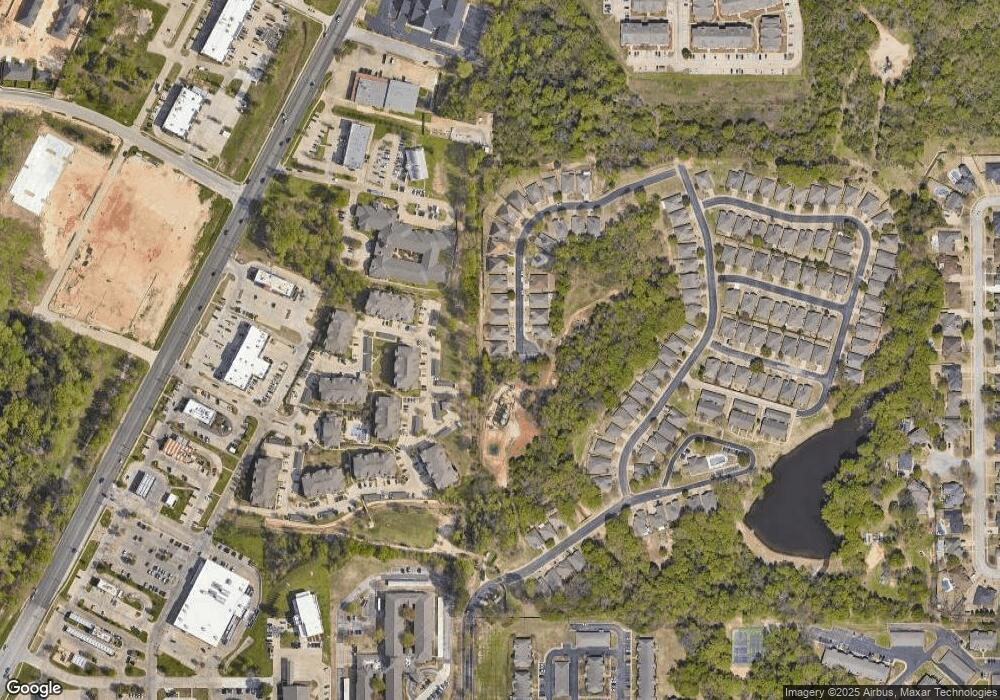
Map
Nearby Homes
- 5821 Cross Creek Cir
- 1915 Hollyglen Dr
- 1869 Hollylake Cir
- 5829 Brynmar Ct
- 5290 Tyler Park Dr
- 6030 Hamilton Meadows Way
- 5701 Plantation Dr
- 5803 Stoneleigh Dr
- 6111 Hamilton Meadows Way
- 5900 Stoneleigh Dr
- 6309 Gleneagles Dr
- 1212 Parkview Dr
- 2205 Bradbury Ct
- 1408 Woodbridge Dr
- 1521 Rice Rd
- 1521 Rice Rd Unit Z104
- 1521 Rice Rd Unit E105
- 973 Creekside Dr
- 940 La Vista Dr
- 1601 Brandywine Dr
- 5827 5827 Cross Creek Cir
- 5825 Cross Creek Cir
- 5825 5825 Cross Creek Cir
- 5823 Cross Creek Cir
- 5818 Cross Creek Cir
- 5818 5818 Cross Creek
- 5816 Cross Creek Cir
- 5814 Cross Creek Cir
- 5819 5819 Cross Creek Cir
- 5819 Cross Creek Cir
- 5812 Cross Creek Cir
- 5817 Cross Creek Cir
- 5815 5815 Cross Creek Cir
- 5815 Cross Creek Cir
- 5808 Cross Creek Cir
- 5813 Cross Creek Cir
- 5806 Cross Creek Cir
- 5811 Cross Creek Cir
- 5812 Hollybrook Dr
- 5814 Hollybrook Dr