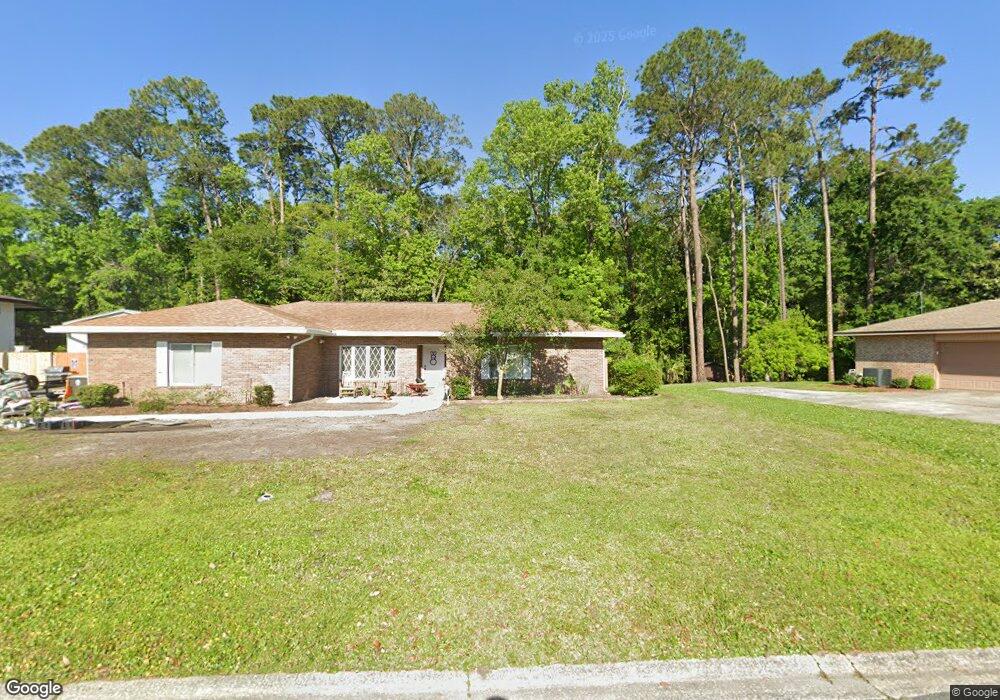
5833 Fort Sumter Rd Jacksonville, FL 32210
Cedar Hills NeighborhoodEstimated Value: $310,000 - $331,000
3
Beds
2
Baths
1,933
Sq Ft
$165/Sq Ft
Est. Value
About This Home
This home is located at 5833 Fort Sumter Rd, Jacksonville, FL 32210 and is currently estimated at $318,154, approximately $164 per square foot. 5833 Fort Sumter Rd is a home located in Duval County with nearby schools including Hidden Oaks Elementary, Westside Middle School, and Portola High School.
Ownership History
Date
Name
Owned For
Owner Type
Purchase Details
Closed on
Apr 5, 2018
Sold by
Jensen Dane M and Jensen Britney E
Bought by
Jensen Elizabeth R
Current Estimated Value
Home Financials for this Owner
Home Financials are based on the most recent Mortgage that was taken out on this home.
Original Mortgage
$150,000
Outstanding Balance
$128,968
Interest Rate
4.43%
Mortgage Type
New Conventional
Estimated Equity
$189,187
Purchase Details
Closed on
Jan 17, 2017
Sold by
Jensen Peggy
Bought by
Jensen Dane M and Jensen Britney E
Home Financials for this Owner
Home Financials are based on the most recent Mortgage that was taken out on this home.
Original Mortgage
$141,391
Interest Rate
3.87%
Mortgage Type
FHA
Purchase Details
Closed on
Sep 15, 2012
Sold by
Weaver Dorothea
Bought by
Weaver Dorothea G and Dorothea G Weaver Living Trust
Purchase Details
Closed on
Dec 3, 1998
Sold by
Ahearn Kay D Futch and Futch Kay D
Bought by
Futch Kenneth F
Create a Home Valuation Report for This Property
The Home Valuation Report is an in-depth analysis detailing your home's value as well as a comparison with similar homes in the area
Home Values in the Area
Average Home Value in this Area
Purchase History
| Date | Buyer | Sale Price | Title Company |
|---|---|---|---|
| Jensen Elizabeth R | $160,000 | Attorney | |
| Jensen Dane M | $144,000 | Landmark Title | |
| Weaver Dorothea G | -- | Attorney | |
| Futch Kenneth F | $100 | -- |
Source: Public Records
Mortgage History
| Date | Status | Borrower | Loan Amount |
|---|---|---|---|
| Open | Jensen Elizabeth R | $150,000 | |
| Previous Owner | Jensen Dane M | $141,391 |
Source: Public Records
Tax History Compared to Growth
Tax History
| Year | Tax Paid | Tax Assessment Tax Assessment Total Assessment is a certain percentage of the fair market value that is determined by local assessors to be the total taxable value of land and additions on the property. | Land | Improvement |
|---|---|---|---|---|
| 2025 | $3,030 | $202,888 | -- | -- |
| 2024 | $2,942 | $197,171 | -- | -- |
| 2023 | $2,942 | $191,429 | $0 | $0 |
| 2022 | $2,693 | $185,854 | $0 | $0 |
| 2021 | $2,670 | $180,441 | $0 | $0 |
| 2020 | $2,642 | $177,950 | $0 | $0 |
| 2019 | $2,302 | $158,404 | $0 | $0 |
| 2018 | $2,352 | $160,041 | $34,000 | $126,041 |
| 2017 | $2,865 | $145,545 | $28,000 | $117,545 |
| 2016 | $1,836 | $128,821 | $0 | $0 |
| 2015 | $1,853 | $127,926 | $0 | $0 |
| 2014 | $1,854 | $126,911 | $0 | $0 |
Source: Public Records
Map
Nearby Homes
- 4302 Buck Point Rd
- 3949 Fall Terrace
- 4324 Charleston Ln
- 4036 Blanding Blvd
- 4109 Tyndale Dr
- 6217 Sage Dr
- 5568 La Moya Ave Unit 9
- 5590 La Moya Ave
- 6116 Sudbury Ave S
- 4034 Tyndale Dr
- 4635 Arthur Durham Dr E
- 6220 Graves St
- 6256 Sage Dr
- 4014 Rendale Dr
- 6234 Alexon Dr
- 5400 La Moya Ave Unit 24
- 5400 La Moya Ave Unit 30
- 3903 Rendale Dr N
- 6216 Sudbury Ave S
- 4152 Arcot Cir
- 5845 Fort Sumter Rd
- 5819 Fort Sumter Rd
- 5838 Fort Sumter Rd
- 5828 Fort Sumter Rd
- 4374 Buck Point Rd
- 5911 Swamp Fox Rd
- 5802 Fort Sumter Rd
- 5823 Swamp Fox Rd
- 5948 Swamp Fox Rd
- 5924 Swamp Fox Rd
- 4360 Buck Point Rd
- 5847 Swamp Fox Rd
- 5805 Swamp Fox Rd
- 4383 Buck Point Rd
- 5902 Swamp Fox Rd
- 5778 Fort Sumter Rd
- 5779 Swamp Fox Rd
- 5898 Swamp Fox Rd
- 4346 Buck Point Rd
- 4355 Buck Point Rd