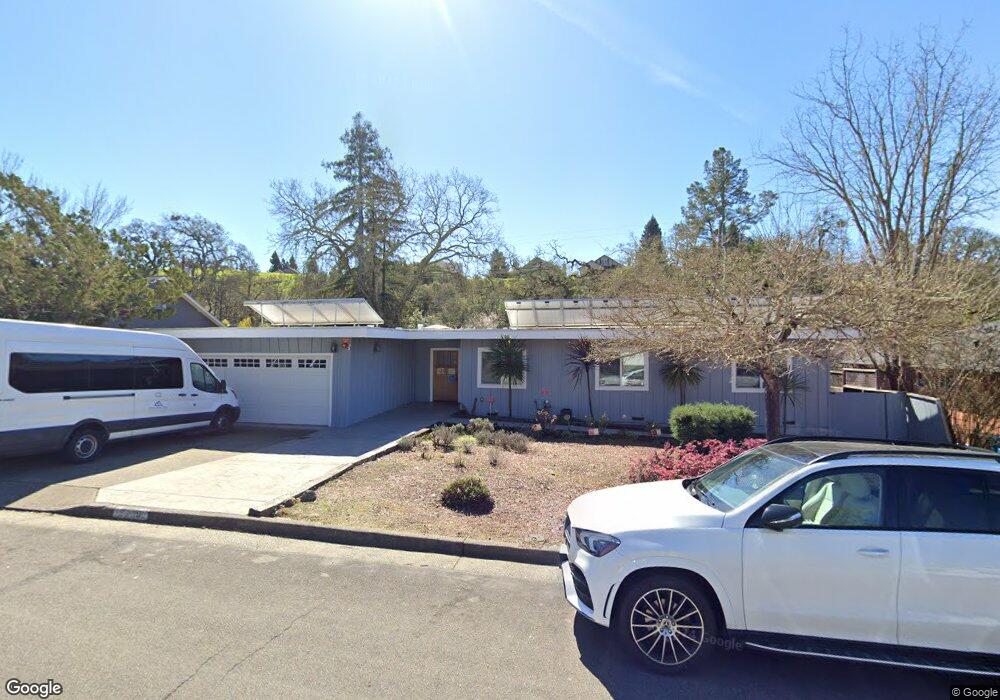
5838 Monte Verde Dr Santa Rosa, CA 95409
Skyhawk NeighborhoodEstimated Value: $970,082
4
Beds
2
Baths
2,401
Sq Ft
$404/Sq Ft
Est. Value
About This Home
This home is located at 5838 Monte Verde Dr, Santa Rosa, CA 95409 and is currently estimated at $970,082, approximately $404 per square foot. 5838 Monte Verde Dr is a home located in Sonoma County with nearby schools including Sequoia Elementary School, Rincon Valley Middle School, and Maria Carrillo High School.
Ownership History
Date
Name
Owned For
Owner Type
Purchase Details
Closed on
Dec 10, 2015
Sold by
Stinson Sebastian and Stinson Kimberley Ann
Bought by
Brilliant Corners Brilliant
Current Estimated Value
Home Financials for this Owner
Home Financials are based on the most recent Mortgage that was taken out on this home.
Original Mortgage
$576,000
Outstanding Balance
$454,908
Interest Rate
3.83%
Mortgage Type
Commercial
Estimated Equity
$515,174
Purchase Details
Closed on
Dec 23, 2010
Sold by
Varenna At Fountaingrove Llc
Bought by
Stinson Sebastian and Stinson Kimberley Ann
Home Financials for this Owner
Home Financials are based on the most recent Mortgage that was taken out on this home.
Original Mortgage
$357,000
Interest Rate
4.34%
Mortgage Type
Commercial
Purchase Details
Closed on
Sep 23, 2010
Sold by
Thompson Jack M and Thompson Margaret R
Bought by
Varenna At Fountaingrove Llc
Create a Home Valuation Report for This Property
The Home Valuation Report is an in-depth analysis detailing your home's value as well as a comparison with similar homes in the area
Home Values in the Area
Average Home Value in this Area
Purchase History
| Date | Buyer | Sale Price | Title Company |
|---|---|---|---|
| Brilliant Corners Brilliant | $720,000 | First American Title Company | |
| Stinson Sebastian | $457,000 | Stewart Title | |
| Varenna At Fountaingrove Llc | $431,000 | Stewart Title Of California |
Source: Public Records
Mortgage History
| Date | Status | Borrower | Loan Amount |
|---|---|---|---|
| Open | Brilliant Corners Brilliant | $576,000 | |
| Previous Owner | Stinson Sebastian | $357,000 |
Source: Public Records
Tax History Compared to Growth
Tax History
| Year | Tax Paid | Tax Assessment Tax Assessment Total Assessment is a certain percentage of the fair market value that is determined by local assessors to be the total taxable value of land and additions on the property. | Land | Improvement |
|---|---|---|---|---|
| 2025 | $9,946 | $852,326 | $340,929 | $511,397 |
| 2024 | $9,946 | $835,615 | $334,245 | $501,370 |
| 2023 | $9,946 | $819,232 | $327,692 | $491,540 |
| 2022 | $9,189 | $803,169 | $321,267 | $481,902 |
| 2021 | $9,006 | $787,421 | $314,968 | $472,453 |
| 2020 | $8,973 | $779,348 | $311,739 | $467,609 |
| 2019 | $8,891 | $764,068 | $305,627 | $458,441 |
| 2018 | $8,838 | $749,087 | $299,635 | $449,452 |
| 2017 | $8,678 | $734,400 | $293,760 | $440,640 |
| 2016 | $8,532 | $720,000 | $288,000 | $432,000 |
| 2015 | $5,728 | $487,161 | $186,550 | $300,611 |
| 2014 | $5,521 | $477,619 | $182,896 | $294,723 |
Source: Public Records
Map
Nearby Homes
- 5794 Owl Hill Ave
- 5969 Vista Ridge
- 5985 Vista Ridge
- 5980 Vista Ridge
- 1826 San Ramon Way
- 5741 Evening Way
- 5518 Marit Dr
- 5974 Sunhawk Dr
- 5682 Raters Dr
- 1431 Nighthawk Place
- 5907 Mountain Hawk Dr
- 184 El Encanto Way
- 5388 Sonoma Hwy
- 5644 Eastlake Dr
- 607 Scotland Dr
- 676 Scotland Ct
- 852/848 Los Alamos Rd
- 5209 San Luis Ave
- 864 Los Alamos Rd
- 5088 Firestone Ct
- 5846 Monte Verde Dr
- 5830 Monte Verde Dr
- 5824 Monte Verde Dr
- 5841 Monte Verde Dr
- 5850 Monte Verde Dr
- 5835 Monte Verde Dr
- 5847 Monte Verde Dr
- 5829 Monte Verde Dr
- 5816 Monte Verde Dr
- 5854 Monte Verde Dr
- 5851 Monte Verde Dr
- 5823 Monte Verde Dr
- 5836 Yerba Buena Rd
- 5842 Yerba Buena Rd
- 5808 Monte Verde Dr
- 5830 Yerba Buena Rd
- 5910 Monte Verde Dr
- 5817 Monte Verde Dr
- 5855 Monte Verde Dr
- 5826 Yerba Buena Rd