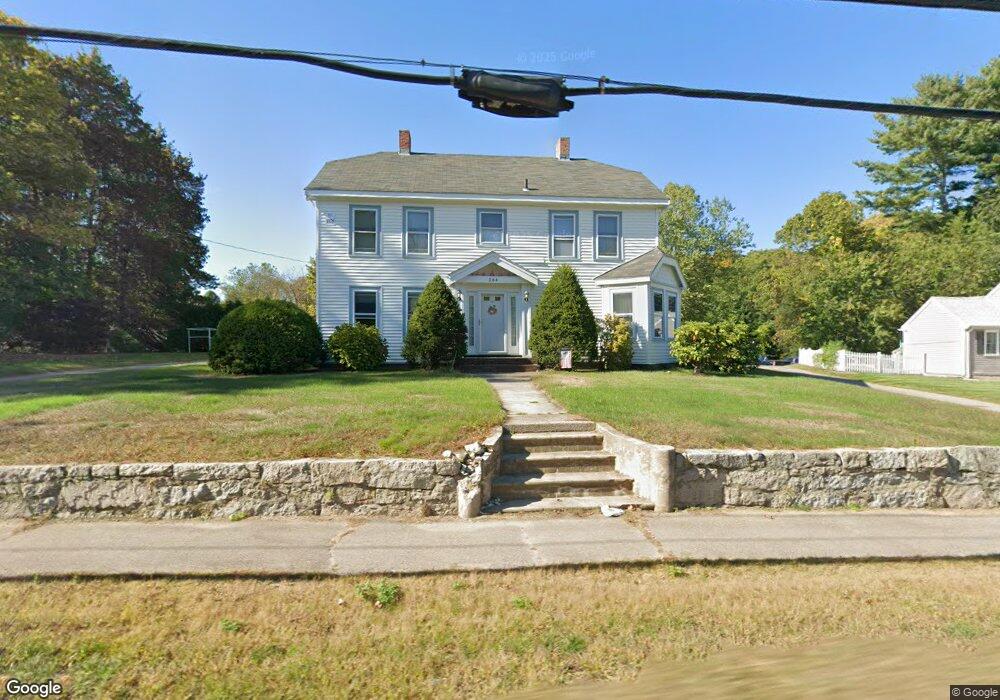
584 South St Wrentham, MA 02093
Estimated Value: $652,000 - $838,000
4
Beds
2
Baths
3,264
Sq Ft
$218/Sq Ft
Est. Value
About This Home
This home is located at 584 South St, Wrentham, MA 02093 and is currently estimated at $713,040, approximately $218 per square foot. 584 South St is a home located in Norfolk County with nearby schools including Delaney Elementary School and Charles E Roderick.
Ownership History
Date
Name
Owned For
Owner Type
Purchase Details
Closed on
Oct 29, 2001
Sold by
Murray William R
Bought by
Johnson William E and Johnson Donna M
Current Estimated Value
Home Financials for this Owner
Home Financials are based on the most recent Mortgage that was taken out on this home.
Original Mortgage
$168,000
Outstanding Balance
$66,340
Interest Rate
6.86%
Mortgage Type
Purchase Money Mortgage
Estimated Equity
$646,700
Create a Home Valuation Report for This Property
The Home Valuation Report is an in-depth analysis detailing your home's value as well as a comparison with similar homes in the area
Home Values in the Area
Average Home Value in this Area
Purchase History
| Date | Buyer | Sale Price | Title Company |
|---|---|---|---|
| Johnson William E | $210,000 | -- |
Source: Public Records
Mortgage History
| Date | Status | Borrower | Loan Amount |
|---|---|---|---|
| Open | Johnson William E | $168,000 |
Source: Public Records
Tax History Compared to Growth
Tax History
| Year | Tax Paid | Tax Assessment Tax Assessment Total Assessment is a certain percentage of the fair market value that is determined by local assessors to be the total taxable value of land and additions on the property. | Land | Improvement |
|---|---|---|---|---|
| 2025 | $6,259 | $540,000 | $262,200 | $277,800 |
| 2024 | $6,454 | $537,800 | $262,200 | $275,600 |
| 2023 | $6,509 | $515,800 | $238,300 | $277,500 |
| 2022 | $6,138 | $449,000 | $231,700 | $217,300 |
| 2021 | $6,241 | $443,600 | $216,600 | $227,000 |
| 2020 | $4,995 | $350,500 | $165,300 | $185,200 |
| 2019 | $4,949 | $350,500 | $165,300 | $185,200 |
| 2018 | $5,591 | $392,600 | $165,400 | $227,200 |
| 2017 | $5,208 | $365,500 | $162,300 | $203,200 |
| 2016 | $5,138 | $359,800 | $157,600 | $202,200 |
| 2015 | $4,927 | $328,900 | $151,500 | $177,400 |
| 2014 | $4,846 | $316,500 | $145,700 | $170,800 |
Source: Public Records
Map
Nearby Homes
- Lot 1 - Blueberry 2 Car Plan at King Philip Estates
- Lot 8 - Blueberry 2 Car Plan at King Philip Estates
- Lot 5 - Hughes 2 car Plan at King Philip Estates
- Lot 6 - Blueberry 3 Car Plan at King Philip Estates
- Lot 2 - Camden 2 Car Plan at King Philip Estates
- Lot 7 - Cedar Plan at King Philip Estates
- Lot 4 - Hemingway 2 Car Plan at King Philip Estates
- Lot 3 - Blueberry 2 Car Plan at King Philip Estates
- Lot 3 - 14 Earle Stewart Ln
- 11 Earle Stewart Ln
- 791 South St Unit 5
- 131 Creek St Unit 7
- 319 Taunton St
- 10 Nature View Dr
- 15 Nature View Dr
- 570 Franklin St
- 1204 South St
- 1222 South St
- 50 Green St
- 440 Chestnut St
- 582 South St
- 576 South St
- 577 South St
- 574 South St
- 583 South St
- 546 South St Unit 3
- 546 South St
- 589 South St
- 589 South St Unit 1
- 597 South St
- 567 South St
- 534 South St Unit 4
- 534 South St
- 606 South St
- 4 Village Way
- 531 South St
- 531 South St Unit 2
- 531 South St Unit 1
- 531 South St Unit 3
- 612 South St