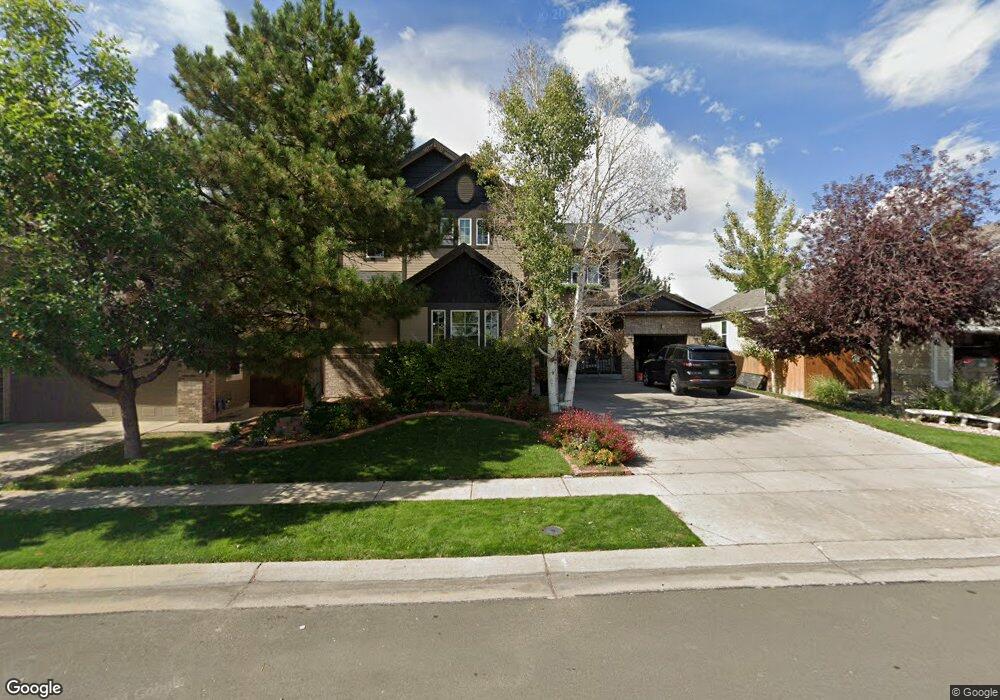
585 Hayloft Way Brighton, CO 80601
Estimated Value: $553,727 - $641,000
3
Beds
3
Baths
2,299
Sq Ft
$256/Sq Ft
Est. Value
About This Home
This home is located at 585 Hayloft Way, Brighton, CO 80601 and is currently estimated at $588,432, approximately $255 per square foot. 585 Hayloft Way is a home located in Adams County with nearby schools including Overland Trail Middle School, Brighton High School, and Bromley East Charter School.
Ownership History
Date
Name
Owned For
Owner Type
Purchase Details
Closed on
Mar 11, 2015
Sold by
Chmielewski Thomas G and Jarabek Kelly A
Bought by
Chmielewski Thomas G and Jarabek Chmielewski Kelly A
Current Estimated Value
Home Financials for this Owner
Home Financials are based on the most recent Mortgage that was taken out on this home.
Original Mortgage
$215,700
Outstanding Balance
$77,296
Interest Rate
3.6%
Mortgage Type
New Conventional
Estimated Equity
$511,136
Purchase Details
Closed on
Jan 3, 2007
Sold by
Gmac Model Home Finance Llc
Bought by
Chmielewski Thomas G and Jarabek Kelly A
Home Financials for this Owner
Home Financials are based on the most recent Mortgage that was taken out on this home.
Original Mortgage
$200,000
Interest Rate
6.1%
Mortgage Type
Unknown
Purchase Details
Closed on
Oct 27, 2003
Sold by
U S Home Corp
Bought by
Gmac Model Home Finance Inc
Create a Home Valuation Report for This Property
The Home Valuation Report is an in-depth analysis detailing your home's value as well as a comparison with similar homes in the area
Home Values in the Area
Average Home Value in this Area
Purchase History
| Date | Buyer | Sale Price | Title Company |
|---|---|---|---|
| Chmielewski Thomas G | -- | Fitco | |
| Chmielewski Thomas G | $250,000 | North American Title | |
| Gmac Model Home Finance Inc | $285,000 | -- |
Source: Public Records
Mortgage History
| Date | Status | Borrower | Loan Amount |
|---|---|---|---|
| Open | Chmielewski Thomas G | $215,700 | |
| Closed | Chmielewski Thomas G | $200,000 |
Source: Public Records
Tax History Compared to Growth
Tax History
| Year | Tax Paid | Tax Assessment Tax Assessment Total Assessment is a certain percentage of the fair market value that is determined by local assessors to be the total taxable value of land and additions on the property. | Land | Improvement |
|---|---|---|---|---|
| 2024 | $5,983 | $34,570 | $7,190 | $27,380 |
| 2023 | $5,978 | $39,850 | $7,780 | $32,070 |
| 2022 | $4,967 | $29,410 | $6,320 | $23,090 |
| 2021 | $4,859 | $29,410 | $6,320 | $23,090 |
| 2020 | $5,028 | $30,550 | $6,510 | $24,040 |
| 2019 | $5,291 | $30,550 | $6,510 | $24,040 |
| 2018 | $4,674 | $25,070 | $6,840 | $18,230 |
| 2017 | $4,678 | $25,070 | $6,840 | $18,230 |
| 2016 | $3,883 | $20,750 | $3,900 | $16,850 |
| 2015 | $3,869 | $20,750 | $3,900 | $16,850 |
| 2014 | $3,195 | $17,250 | $3,340 | $13,910 |
Source: Public Records
Map
Nearby Homes
- 608 Hayloft Way
- 445 Tumbleweed Dr
- 4250 Combine Place
- 4545 Oxbow Dr
- 4649 Spinning Wheel Dr
- 4532 Dewey Ln
- 256 Homestead Way
- 4645 Longs Peak St
- 4479 Boone Cir
- 215 Blue Bonnet Dr Unit 9C
- 4455 Boone Cir
- 4439 Boone Cir
- 427 Silo Ct
- 207 Harrow Ct
- 267 Wooten Ave
- 258 N 45th Ave
- 4436 Windmill Dr
- 432 Hedgerow Way
- 229 Wooten Ave
- 4589 Thistle Dr
- 575 Hayloft Way
- 595 Hayloft Way
- 565 Hayloft Way
- 555 Hayloft Way
- 603 Hayloft Way
- 545 Hayloft Way
- 609 Hayloft Way
- 604 Hayloft Way
- 546 Hayloft Way
- 535 Hayloft Way
- 613 Hayloft Way
- 536 Hayloft Way
- 610 Hayloft Way
- 525 Hayloft Way
- 619 Hayloft Way
- 547 Stetson Ct
- 625 Tumbleweed Dr
- 526 Hayloft Way
- 614 Hayloft Way
- 584 Branding Iron Ct