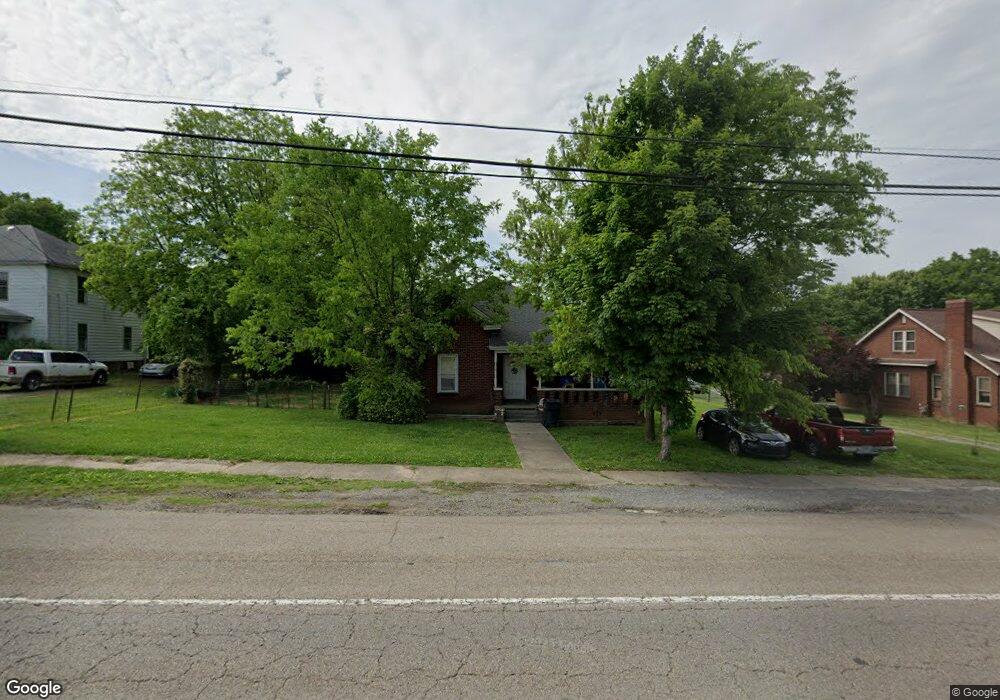
5851 E Andrew Johnson Hwy Russellville, TN 37860
Estimated Value: $185,000 - $298,000
--
Bed
1
Bath
1,368
Sq Ft
$166/Sq Ft
Est. Value
About This Home
This home is located at 5851 E Andrew Johnson Hwy, Russellville, TN 37860 and is currently estimated at $226,466, approximately $165 per square foot. 5851 E Andrew Johnson Hwy is a home located in Hamblen County with nearby schools including Russellville Elementary School, East Ridge Middle School, and Morristown East High School.
Ownership History
Date
Name
Owned For
Owner Type
Purchase Details
Closed on
Jan 5, 2016
Sold by
Wells Christopher
Bought by
Wells Christopher and Dalton John E
Current Estimated Value
Purchase Details
Closed on
Oct 20, 2015
Sold by
Wallen Stevie W
Bought by
Wells Christopher
Purchase Details
Closed on
Oct 19, 2015
Sold by
Wallen Stevie W
Bought by
Wells Christopher
Purchase Details
Closed on
Aug 17, 2005
Sold by
Quillen David
Bought by
Wallen Stevie W
Home Financials for this Owner
Home Financials are based on the most recent Mortgage that was taken out on this home.
Original Mortgage
$70,400
Interest Rate
5.64%
Purchase Details
Closed on
Nov 3, 2004
Sold by
Cagle Sabrina Renea
Bought by
David Quillen
Purchase Details
Closed on
Nov 11, 1993
Bought by
Mahan Marietta T L and Mahan E
Purchase Details
Closed on
Dec 29, 1983
Bought by
Mahan Marietta T
Create a Home Valuation Report for This Property
The Home Valuation Report is an in-depth analysis detailing your home's value as well as a comparison with similar homes in the area
Home Values in the Area
Average Home Value in this Area
Purchase History
| Date | Buyer | Sale Price | Title Company |
|---|---|---|---|
| Wells Christopher | -- | -- | |
| Wells Christopher | $18,796 | -- | |
| Wells Christopher | -- | -- | |
| Wallen Stevie W | $88,000 | -- | |
| David Quillen | $35,000 | -- | |
| Mahan Marietta T L | $88,700 | -- | |
| Mahan Marietta T | -- | -- |
Source: Public Records
Mortgage History
| Date | Status | Borrower | Loan Amount |
|---|---|---|---|
| Previous Owner | Mahan Marietta T | $70,400 | |
| Previous Owner | Mahan Marietta T | $17,600 |
Source: Public Records
Tax History Compared to Growth
Tax History
| Year | Tax Paid | Tax Assessment Tax Assessment Total Assessment is a certain percentage of the fair market value that is determined by local assessors to be the total taxable value of land and additions on the property. | Land | Improvement |
|---|---|---|---|---|
| 2024 | $505 | $25,650 | $3,350 | $22,300 |
| 2023 | $505 | $25,650 | $0 | $0 |
| 2022 | $505 | $25,650 | $3,350 | $22,300 |
| 2021 | $505 | $25,650 | $3,350 | $22,300 |
| 2020 | $505 | $25,650 | $3,350 | $22,300 |
| 2019 | $464 | $21,775 | $6,250 | $15,525 |
| 2018 | $464 | $21,775 | $6,250 | $15,525 |
| 2017 | $464 | $21,775 | $6,250 | $15,525 |
| 2016 | $433 | $21,775 | $6,250 | $15,525 |
| 2015 | $403 | $21,775 | $6,250 | $15,525 |
| 2014 | -- | $21,775 | $6,250 | $15,525 |
| 2013 | -- | $23,525 | $0 | $0 |
Source: Public Records
Map
Nearby Homes
- 5790 N 2nd St
- 5740 Dodson Ferry Rd
- 6284 Old Russellville Pike
- 6330 Old Russellville Pike
- 233 Harvey Dr
- 6421 Old Russellville Pike
- 6563 E Andrew Johnson Hwy
- 770 Harvey Dr
- 505 Mary St
- 6650 E Andrew Johnson Hwy
- 354 Volunteer Dr
- 5659 Browning Way
- 5751 Charlene Dr
- 814 Pullen Rd
- 00 Shinbone E Sugar Hollow Rd
- 5085 Old Kentucky Rd
- 5556 Denton Dr
- 2145 Fall Creek Rd
- 5835 E Andrew Johnson Hwy
- 5877 E Andrew Johnson Hwy
- 5850 Old Russellville Pike
- 5832 Old Russellville Pike
- 5836 Old Russellville Pike
- 5828 Old Russellville Hwy
- 5828 Old Russellville Pike
- 5839 Old Russellville Pike
- 5818 Old Russellville Pike
- 5817 E Andrew Johnson Hwy
- 5853 Old Russellville Pike
- 5815 Old Russellville Pike
- 5820 Dodson Ferry Rd
- 124 Warrensburg Rd
- 5915 E Andrew Johnson Hwy
- 5885 Old Russellville Pike
- 5903 Old Russellville Pike
- 5789 E Andrew Johnson Hwy
- 5796 Old Russellville Pike
- 5814 Dodson Ferry Rd