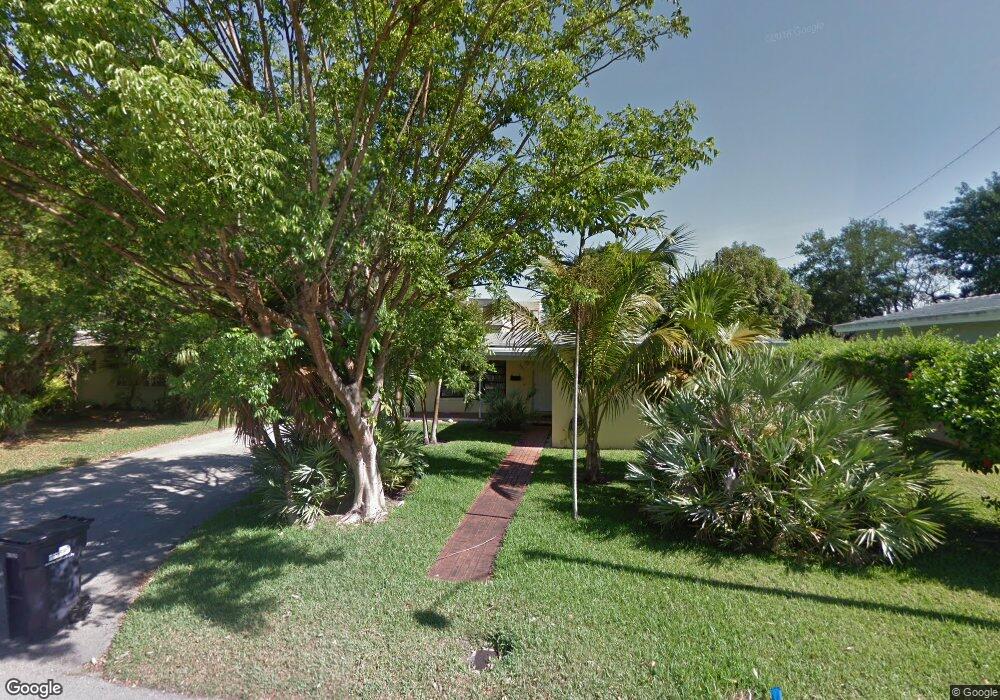
5851 SW 76th St South Miami, FL 33143
Estimated Value: $2,120,000 - $2,476,000
3
Beds
2
Baths
1,520
Sq Ft
$1,515/Sq Ft
Est. Value
About This Home
This home is located at 5851 SW 76th St, South Miami, FL 33143 and is currently estimated at $2,302,236, approximately $1,514 per square foot. 5851 SW 76th St is a home located in Miami-Dade County with nearby schools including Sunset Elementary School, Ponce de Leon Middle School, and Coral Gables Senior High School.
Ownership History
Date
Name
Owned For
Owner Type
Purchase Details
Closed on
Sep 8, 2009
Sold by
Keppler William J
Bought by
Kelly Katherine L
Current Estimated Value
Home Financials for this Owner
Home Financials are based on the most recent Mortgage that was taken out on this home.
Original Mortgage
$324,000
Outstanding Balance
$211,895
Interest Rate
5.19%
Mortgage Type
New Conventional
Estimated Equity
$2,090,341
Purchase Details
Closed on
Mar 10, 2009
Sold by
Keppler William J
Bought by
Keppler William J
Purchase Details
Closed on
Jun 3, 1996
Sold by
Ostapski Andrew Ostapski S and Ostapski Maribel C
Bought by
Keppler William J and Wheeldon Ann E
Home Financials for this Owner
Home Financials are based on the most recent Mortgage that was taken out on this home.
Original Mortgage
$133,950
Interest Rate
7.93%
Mortgage Type
New Conventional
Create a Home Valuation Report for This Property
The Home Valuation Report is an in-depth analysis detailing your home's value as well as a comparison with similar homes in the area
Home Values in the Area
Average Home Value in this Area
Purchase History
| Date | Buyer | Sale Price | Title Company |
|---|---|---|---|
| Kelly Katherine L | $415,000 | Dba Ewm Title | |
| Keppler William J | -- | Dba Ewm Title | |
| Keppler William J | -- | Attorney | |
| Keppler William J | $141,000 | -- |
Source: Public Records
Mortgage History
| Date | Status | Borrower | Loan Amount |
|---|---|---|---|
| Open | Kelly Katherine L | $324,000 | |
| Previous Owner | Keppler William J | $117,000 | |
| Previous Owner | Keppler William J | $133,950 |
Source: Public Records
Tax History Compared to Growth
Tax History
| Year | Tax Paid | Tax Assessment Tax Assessment Total Assessment is a certain percentage of the fair market value that is determined by local assessors to be the total taxable value of land and additions on the property. | Land | Improvement |
|---|---|---|---|---|
| 2025 | $15,819 | $896,765 | -- | -- |
| 2024 | $15,423 | $871,492 | -- | -- |
| 2023 | $15,423 | $846,109 | $0 | $0 |
| 2022 | $14,980 | $821,466 | $0 | $0 |
| 2021 | $4,602 | $268,888 | $0 | $0 |
| 2020 | $6,483 | $362,085 | $0 | $0 |
| 2019 | $6,335 | $353,945 | $0 | $0 |
| 2018 | $6,061 | $347,346 | $0 | $0 |
| 2017 | $5,945 | $340,202 | $0 | $0 |
| 2016 | $5,922 | $333,205 | $0 | $0 |
| 2015 | $5,985 | $330,889 | $0 | $0 |
| 2014 | $6,068 | $328,263 | $0 | $0 |
Source: Public Records
Map
Nearby Homes
- 5864 SW 74th Terrace Unit G
- 5839 SW 74th Terrace Unit 305
- 5909 SW 76th St
- 7621 SW 59th Ct
- 5776 SW 77th Terrace
- 7561 SW 56th Ct
- 7620 SW 56th Ave Unit 4
- 7700 SW 56th Ave Unit 4
- 6021 SW 76th St
- 6023 SW 76th St
- 7255 SW 55th Ave
- 7620 SW 54th Ct Unit 19C
- 5858 SW 80th St
- 5975 SW 80th St
- 5835 SW 81st St
- 5847 SW 81st St
- 6003 SW 80th St
- 6001 SW 70th St Unit 429
- 6001 SW 70th St Unit 139
- 6001 SW 70th St Unit 542
- 5861 SW 76th St
- 5841 SW 76th St
- 5831 SW 76th St
- 5862 SW 76th St
- 7563 SW 59th Ave
- 7541 SW 59th Ave
- 7611 SW 59th Ave
- 7508 7508 Sw 58 Av # 7508 Unit 7508
- 7516 7516 Sw 58th Ave # 7516 Unit 7516
- 7502 SW 58th Ave Unit 7502
- 7524 SW 58th Ave Unit 7524
- 7516 SW 58th Ave Unit 7516
- 7520 SW 58th Ave Unit 7520
- 7522 SW 58th Ave Unit 7522
- 7512 SW 58th Ave Unit 7512
- 7518 SW 58th Ave Unit 7518
- 7506 SW 58th Ave Unit 7506
- 7504 SW 58th Ave Unit 7504
- 7500 SW 58th Ave Unit 7500
- 5864 SW 76th St