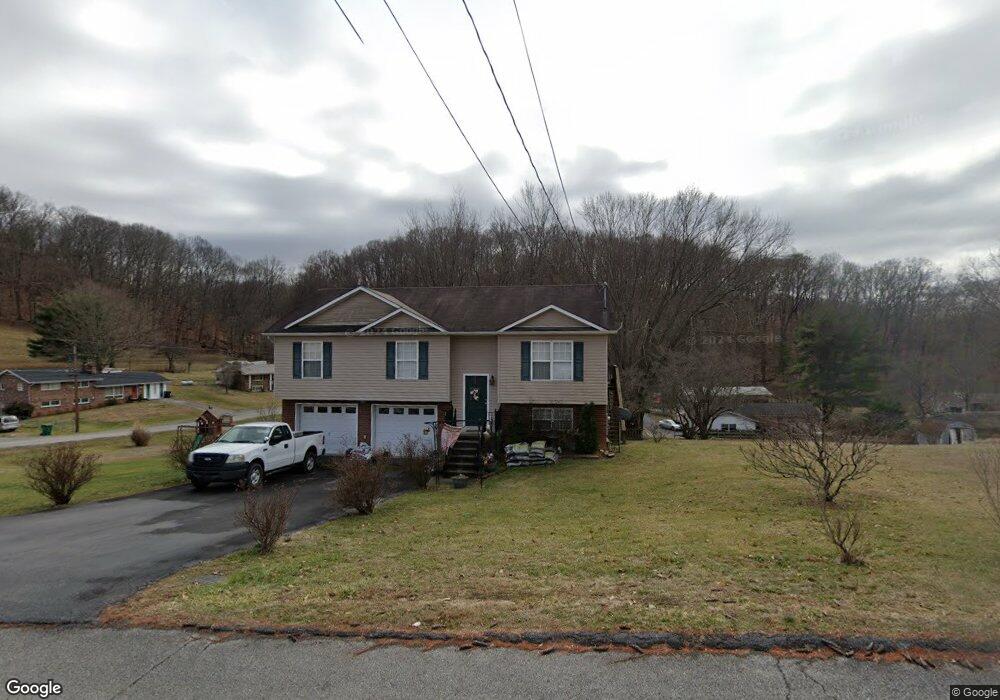
5859 Seneca Rd Kingsport, TN 37664
Estimated Value: $298,000 - $336,855
3
Beds
3
Baths
1,712
Sq Ft
$189/Sq Ft
Est. Value
About This Home
This home is located at 5859 Seneca Rd, Kingsport, TN 37664 and is currently estimated at $324,214, approximately $189 per square foot. 5859 Seneca Rd is a home located in Sullivan County with nearby schools including Indian Springs Elementary School and Sullivan Central Middle School.
Ownership History
Date
Name
Owned For
Owner Type
Purchase Details
Closed on
Aug 31, 2017
Sold by
Sharpe Chad Alan and Sharpe Christy Kathleen
Bought by
Phillips Robert A and Phillips Shelby D
Current Estimated Value
Home Financials for this Owner
Home Financials are based on the most recent Mortgage that was taken out on this home.
Original Mortgage
$161,500
Outstanding Balance
$134,973
Interest Rate
3.93%
Mortgage Type
New Conventional
Estimated Equity
$189,241
Purchase Details
Closed on
Jun 23, 2006
Sold by
Larry Fields
Bought by
Alan Sharpe Chad
Home Financials for this Owner
Home Financials are based on the most recent Mortgage that was taken out on this home.
Original Mortgage
$139,900
Interest Rate
6.55%
Purchase Details
Closed on
Jun 1, 2005
Sold by
Coates C A
Bought by
Larry Fields
Home Financials for this Owner
Home Financials are based on the most recent Mortgage that was taken out on this home.
Original Mortgage
$92,720
Interest Rate
5.66%
Create a Home Valuation Report for This Property
The Home Valuation Report is an in-depth analysis detailing your home's value as well as a comparison with similar homes in the area
Home Values in the Area
Average Home Value in this Area
Purchase History
| Date | Buyer | Sale Price | Title Company |
|---|---|---|---|
| Phillips Robert A | $170,000 | Heritage Title & Closing | |
| Alan Sharpe Chad | $139,900 | -- | |
| Larry Fields | $20,000 | -- |
Source: Public Records
Mortgage History
| Date | Status | Borrower | Loan Amount |
|---|---|---|---|
| Open | Phillips Robert A | $161,500 | |
| Previous Owner | Larry Fields | $139,900 | |
| Previous Owner | Larry Fields | $92,720 |
Source: Public Records
Tax History Compared to Growth
Tax History
| Year | Tax Paid | Tax Assessment Tax Assessment Total Assessment is a certain percentage of the fair market value that is determined by local assessors to be the total taxable value of land and additions on the property. | Land | Improvement |
|---|---|---|---|---|
| 2024 | $964 | $38,625 | $5,875 | $32,750 |
| 2023 | $929 | $38,625 | $5,875 | $32,750 |
| 2022 | $929 | $38,625 | $5,875 | $32,750 |
| 2021 | $929 | $38,625 | $5,875 | $32,750 |
| 2020 | $875 | $38,625 | $5,875 | $32,750 |
| 2019 | $875 | $34,050 | $5,875 | $28,175 |
| 2018 | $868 | $34,050 | $5,875 | $28,175 |
| 2017 | $840 | $32,925 | $5,875 | $27,050 |
| 2016 | $905 | $35,150 | $5,875 | $29,275 |
| 2014 | $810 | $35,148 | $0 | $0 |
Source: Public Records
Map
Nearby Homes
- 5825 Cochise Trail
- 5821 Seneca Dr
- 285 Spurgeon Rd
- 708 Hill Rd
- 732 Shadowtown Rd
- 316 Montezuma Rd
- 5509 Memorial Blvd
- 416 S Valley View Cir
- 5404 Memorial Blvd
- 354 Shadowtown Rd
- 782 Harr Town Rd
- 125 Golf Ridge Dr
- 509 Amelia Ct
- 309 Golf Ridge Dr
- 338 Golf Ridge Dr
- 295 Southridge Dr
- 1270 Ridgetop Trail
- 592 Catawba Fieldcrest Development
- 1234 Ridgetop Trail
- 1226 Ridgetop Trail
- 5859 Seneca Dr
- 5860 Cochise Trail
- 5909 Cochise Trail
- 5856 Cochise Trail
- 5905 Cochise Trail
- 5852 Seneca Rd
- 5913 Cochise Trail
- 5853 Seneca Dr
- 5852 Cochise Trail
- 5917 Cochise Trail
- 5901 Cochise Trail
- 5916 Cochise Trail
- 5848 Seneca Rd
- 5853 Cochise Trail
- 5849 Cochise Trail
- 5921 Cochise Trail
- 5845 Cochise Trail
- 5844 Seneca Rd
- 5845 Seneca Dr
- 5845 Seneca Rd