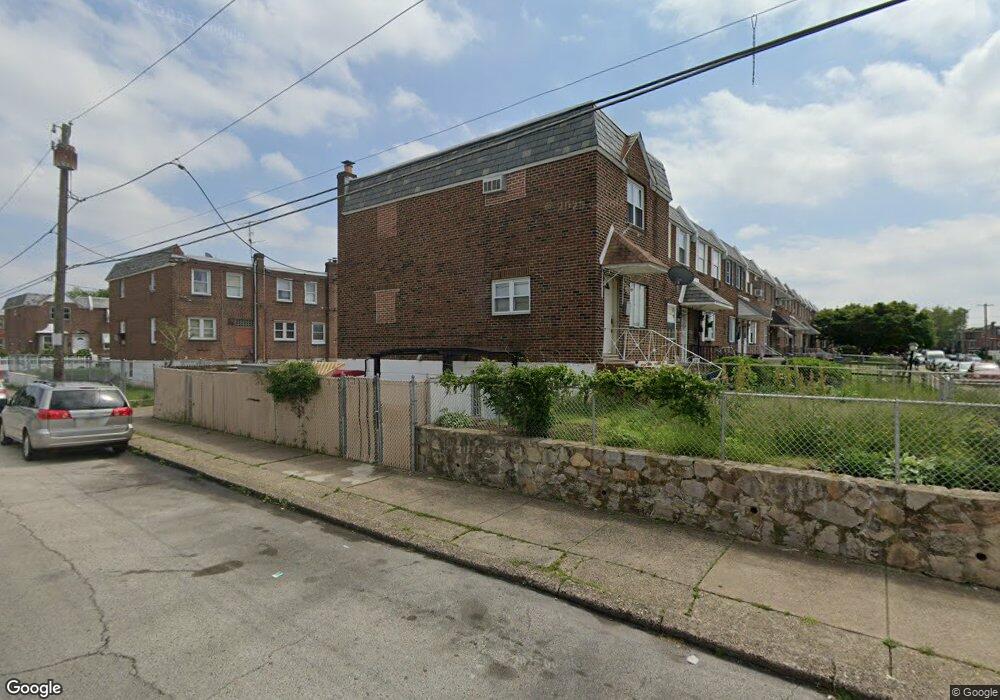
5867 Oakland St Philadelphia, PA 19149
Mayfair NeighborhoodEstimated Value: $197,000 - $218,000
2
Beds
1
Bath
1,090
Sq Ft
$190/Sq Ft
Est. Value
About This Home
This home is located at 5867 Oakland St, Philadelphia, PA 19149 and is currently estimated at $207,638, approximately $190 per square foot. 5867 Oakland St is a home located in Philadelphia County with nearby schools including Ziegler William H School, Frankford High School, and Mastery Schools Smedley Elementary.
Ownership History
Date
Name
Owned For
Owner Type
Purchase Details
Closed on
Oct 29, 2018
Sold by
Alhaj Ragab
Bought by
Mutabar Utaev Jaloliddin and Mutabar Rizaeva
Current Estimated Value
Purchase Details
Closed on
Jan 26, 2015
Sold by
Hafez Brad F and Hafez Osama
Bought by
Alhaj Ragab
Purchase Details
Closed on
Sep 29, 2010
Sold by
Hafez Brad F and Estate Of Baraa Bari Hafez
Bought by
Hafez Brad F and Hafez Osama
Purchase Details
Closed on
Oct 19, 2009
Sold by
Hsbc Bank Usa Na
Bought by
Hafez Baraa
Purchase Details
Closed on
Jul 20, 2009
Sold by
Graham Raiena
Bought by
Hsbc Bank Usa Na
Purchase Details
Closed on
Aug 30, 2002
Sold by
Mazzitelli Pasquale and Mazzitelli Anna
Bought by
Graham Raiena
Home Financials for this Owner
Home Financials are based on the most recent Mortgage that was taken out on this home.
Original Mortgage
$61,500
Interest Rate
7.25%
Create a Home Valuation Report for This Property
The Home Valuation Report is an in-depth analysis detailing your home's value as well as a comparison with similar homes in the area
Home Values in the Area
Average Home Value in this Area
Purchase History
| Date | Buyer | Sale Price | Title Company |
|---|---|---|---|
| Mutabar Utaev Jaloliddin | $101,000 | None Available | |
| Alhaj Ragab | $49,500 | None Available | |
| Hafez Brad F | -- | None Available | |
| Hafez Baraa | $71,000 | None Available | |
| Hsbc Bank Usa Na | $65,000 | None Available | |
| Graham Raiena | $76,900 | -- |
Source: Public Records
Mortgage History
| Date | Status | Borrower | Loan Amount |
|---|---|---|---|
| Previous Owner | Graham Raiena | $61,500 | |
| Closed | Graham Raiena | $15,400 |
Source: Public Records
Tax History Compared to Growth
Tax History
| Year | Tax Paid | Tax Assessment Tax Assessment Total Assessment is a certain percentage of the fair market value that is determined by local assessors to be the total taxable value of land and additions on the property. | Land | Improvement |
|---|---|---|---|---|
| 2026 | $2,100 | $196,200 | $39,240 | $156,960 |
| 2025 | $2,100 | $196,200 | $39,240 | $156,960 |
| 2024 | $2,100 | $196,200 | $39,240 | $156,960 |
| 2023 | $2,100 | $150,000 | $30,000 | $120,000 |
| 2022 | $834 | $105,000 | $30,000 | $75,000 |
| 2021 | $1,464 | $0 | $0 | $0 |
| 2020 | $1,464 | $0 | $0 | $0 |
| 2019 | $1,405 | $0 | $0 | $0 |
| 2018 | $1,524 | $0 | $0 | $0 |
| 2017 | $1,524 | $0 | $0 | $0 |
| 2016 | $1,524 | $0 | $0 | $0 |
| 2015 | $1,459 | $0 | $0 | $0 |
| 2014 | -- | $108,900 | $27,304 | $81,596 |
| 2012 | -- | $12,896 | $2,053 | $10,843 |
Source: Public Records
Map
Nearby Homes
- 1530 Van Kirk St
- 1613 Van Kirk St
- 5828 Akron St
- 1622 E Howell St
- 5844 Saul St
- 5823 Akron St
- 5451 Oakland St
- 1431 Rosalie St
- 6005 Horrocks St
- 5431 Akron St
- 5422 Akron St
- 1606 Benner St
- 1244 E Sanger St
- 7753 E Roosevelt Blvd
- 5407 Saul St
- 6632 E Roosevelt Blvd
- 7040 E Roosevelt Blvd
- 6054 E Roosevelt Blvd
- 7536 E Roosevelt Blvd
- 6840 E Roosevelt Blvd
- 5865 Oakland St
- 5863 Oakland St
- 5861 Oakland St
- 5859 Oakland St
- 5866 Akron St
- 5864 Akron St
- 5857 Oakland St
- 5862 Akron St
- 5860 Akron St
- 5855 Oakland St
- 5858 Akron St
- 5853 Oakland St
- 5856 Akron St
- 1548 Van Kirk St
- 1605 Van Kirk St
- 5854 Akron St
- 5851 Oakland St
- 1603 Van Kirk St
- 1546 Van Kirk St
- 1607 Van Kirk St