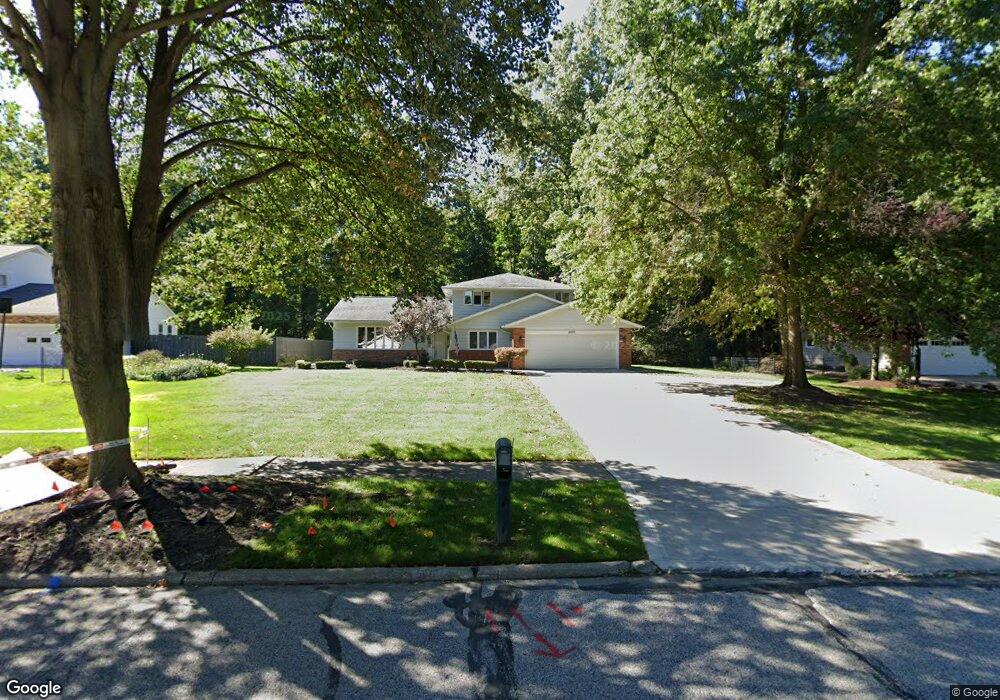
5870 Blair Dr Cleveland, OH 44143
Estimated Value: $440,381 - $474,000
4
Beds
3
Baths
2,570
Sq Ft
$178/Sq Ft
Est. Value
About This Home
This home is located at 5870 Blair Dr, Cleveland, OH 44143 and is currently estimated at $458,345, approximately $178 per square foot. 5870 Blair Dr is a home located in Cuyahoga County with nearby schools including Mayfield High School and Saint Paschal Baylon School.
Ownership History
Date
Name
Owned For
Owner Type
Purchase Details
Closed on
Mar 21, 2024
Sold by
Seaman Patricia A and Corea Anne M
Bought by
Seaman Patricia A and Corea Anne M
Current Estimated Value
Purchase Details
Closed on
Jul 15, 1998
Sold by
Mulgaokar Girish D and Mulgaokar Sharda
Bought by
Corea Anne M and Seaman Patricia A
Home Financials for this Owner
Home Financials are based on the most recent Mortgage that was taken out on this home.
Original Mortgage
$100,000
Interest Rate
7.13%
Purchase Details
Closed on
Apr 3, 1985
Sold by
Mulgaokar Girish D
Bought by
Mulgaokar Girish D and Mulgaokar Sharda
Purchase Details
Closed on
Oct 22, 1981
Sold by
Desilvio Elizabeth
Bought by
Mulgaokar Girish D
Purchase Details
Closed on
Aug 12, 1977
Bought by
Desilvio Elizabeth
Purchase Details
Closed on
Nov 24, 1976
Bought by
Michael Homes Inc
Purchase Details
Closed on
Jan 1, 1975
Bought by
Lipman Paul Trs
Create a Home Valuation Report for This Property
The Home Valuation Report is an in-depth analysis detailing your home's value as well as a comparison with similar homes in the area
Home Values in the Area
Average Home Value in this Area
Purchase History
| Date | Buyer | Sale Price | Title Company |
|---|---|---|---|
| Seaman Patricia A | -- | None Listed On Document | |
| Corea Anne M | $268,500 | -- | |
| Mulgaokar Girish D | -- | -- | |
| Mulgaokar Girish D | $127,000 | -- | |
| Desilvio Elizabeth | $97,900 | -- | |
| Michael Homes Inc | $93,900 | -- | |
| Lipman Paul Trs | -- | -- |
Source: Public Records
Mortgage History
| Date | Status | Borrower | Loan Amount |
|---|---|---|---|
| Previous Owner | Corea Anne M | $100,000 |
Source: Public Records
Tax History Compared to Growth
Tax History
| Year | Tax Paid | Tax Assessment Tax Assessment Total Assessment is a certain percentage of the fair market value that is determined by local assessors to be the total taxable value of land and additions on the property. | Land | Improvement |
|---|---|---|---|---|
| 2024 | $7,155 | $127,820 | $27,545 | $100,275 |
| 2023 | $5,728 | $91,880 | $21,980 | $69,900 |
| 2022 | $5,718 | $91,880 | $21,980 | $69,900 |
| 2021 | $5,669 | $91,880 | $21,980 | $69,900 |
| 2020 | $5,387 | $80,610 | $19,290 | $61,320 |
| 2019 | $5,211 | $230,300 | $55,100 | $175,200 |
| 2018 | $5,193 | $80,610 | $19,290 | $61,320 |
| 2017 | $5,377 | $78,160 | $14,880 | $63,280 |
| 2016 | $5,334 | $78,160 | $14,880 | $63,280 |
| 2015 | $5,172 | $78,160 | $14,880 | $63,280 |
| 2014 | $5,172 | $82,260 | $15,650 | $66,610 |
Source: Public Records
Map
Nearby Homes
- 640 Gloucester Dr
- 592 Rutland Dr
- 595 Jefferson Dr
- 711 Lander Rd
- 6004 Highland Rd
- 784 Lander Rd
- 5807 Wilson Mills Rd
- 6015 Wilson Mills Rd
- 5679 Wilson Mills Rd
- 833 Lander Rd
- V/L Bishop Rd
- 848 Stanwell Dr
- 5560 Highland Rd
- 5485 Kenbridge Dr
- 874 Lander Rd
- 651 Clinton Ln
- 5536 Turnberry Ln
- 920 Rose Blvd
- 916 Cranbrook Dr
- 754 Esther Rd
- 5860 Blair Dr
- 5880 Blair Dr
- 5850 Blair Dr
- 5890 Blair Dr
- 621 Sturbridge Dr
- 623 Sturbridge Dr
- 620 Sturbridge Dr
- 5840 Blair Dr
- 619 Sturbridge Dr
- 630 Gloucester Dr
- 626 Gloucester Dr
- 634 Gloucester Dr
- 616 Sturbridge Dr
- 5830 Blair Dr
- 615 Sturbridge Dr
- 622 Gloucester Dr
- 625 Rutland Dr
- 618 Gloucester Dr
- 612 Sturbridge Dr
- 5820 Blair Dr