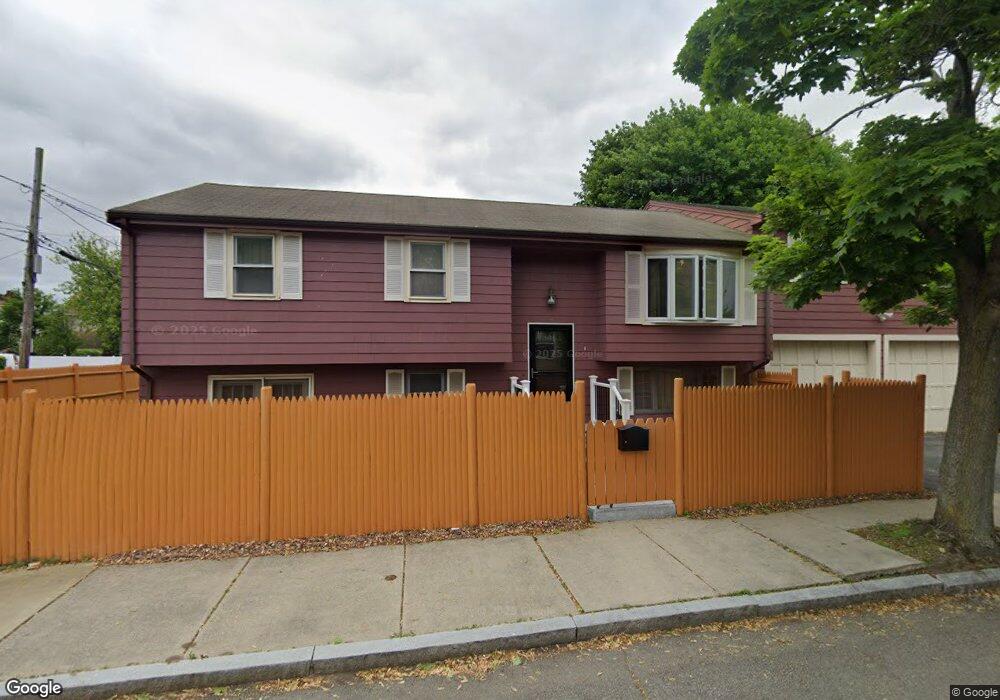
59 Barker Rd Malden, MA 02148
Linden NeighborhoodEstimated Value: $737,000 - $790,899
3
Beds
4
Baths
2,134
Sq Ft
$360/Sq Ft
Est. Value
About This Home
This home is located at 59 Barker Rd, Malden, MA 02148 and is currently estimated at $768,725, approximately $360 per square foot. 59 Barker Rd is a home located in Middlesex County with nearby schools including Malden High School and Malden Catholic.
Ownership History
Date
Name
Owned For
Owner Type
Purchase Details
Closed on
Nov 3, 1992
Sold by
Magaletta Francis J
Bought by
Cao Phong Duc and Nguyen Nguyen
Current Estimated Value
Home Financials for this Owner
Home Financials are based on the most recent Mortgage that was taken out on this home.
Original Mortgage
$76,000
Interest Rate
7.85%
Mortgage Type
Purchase Money Mortgage
Create a Home Valuation Report for This Property
The Home Valuation Report is an in-depth analysis detailing your home's value as well as a comparison with similar homes in the area
Home Values in the Area
Average Home Value in this Area
Purchase History
| Date | Buyer | Sale Price | Title Company |
|---|---|---|---|
| Cao Phong Duc | $152,000 | -- | |
| Cao Phong Duc | $152,000 | -- |
Source: Public Records
Mortgage History
| Date | Status | Borrower | Loan Amount |
|---|---|---|---|
| Open | Cao Phong Duc | $150,000 | |
| Closed | Cao Phong Duc | $76,000 | |
| Previous Owner | Cao Phong Duc | $24,000 |
Source: Public Records
Tax History Compared to Growth
Tax History
| Year | Tax Paid | Tax Assessment Tax Assessment Total Assessment is a certain percentage of the fair market value that is determined by local assessors to be the total taxable value of land and additions on the property. | Land | Improvement |
|---|---|---|---|---|
| 2025 | $73 | $642,500 | $283,200 | $359,300 |
| 2024 | $6,870 | $587,700 | $266,500 | $321,200 |
| 2023 | $6,784 | $556,500 | $241,500 | $315,000 |
| 2022 | $6,506 | $526,800 | $220,700 | $306,100 |
| 2021 | $6,211 | $505,400 | $208,200 | $297,200 |
| 2020 | $5,980 | $472,700 | $192,400 | $280,300 |
| 2019 | $5,730 | $431,800 | $183,200 | $248,600 |
| 2018 | $5,522 | $391,900 | $152,000 | $239,900 |
| 2017 | $5,261 | $371,300 | $152,000 | $219,300 |
| 2016 | $5,019 | $331,100 | $139,500 | $191,600 |
| 2015 | $4,883 | $310,400 | $132,800 | $177,600 |
| 2014 | $4,803 | $298,300 | $120,800 | $177,500 |
Source: Public Records
Map
Nearby Homes
- 32 Delta Terrace
- 563 Lynn St
- 4 Anderson Way Unit 2
- 109 Salem St Unit 405
- 770 Washington Ave Unit 405
- 133 Salem St Unit 418
- 133 Salem St Unit 412
- 133 Salem St Unit 213
- 133 Salem St Unit 416
- 133 Salem St Unit 307
- 133 Salem St Unit 417
- 133 Salem St Unit 414
- 133 Salem St Unit 315
- 133 Salem St Unit 102
- 133 Salem St Unit 317
- 156 Salem St
- 15 Stone St
- 1135 Salem St
- 19 Bellvale St
- 33 Blaine St