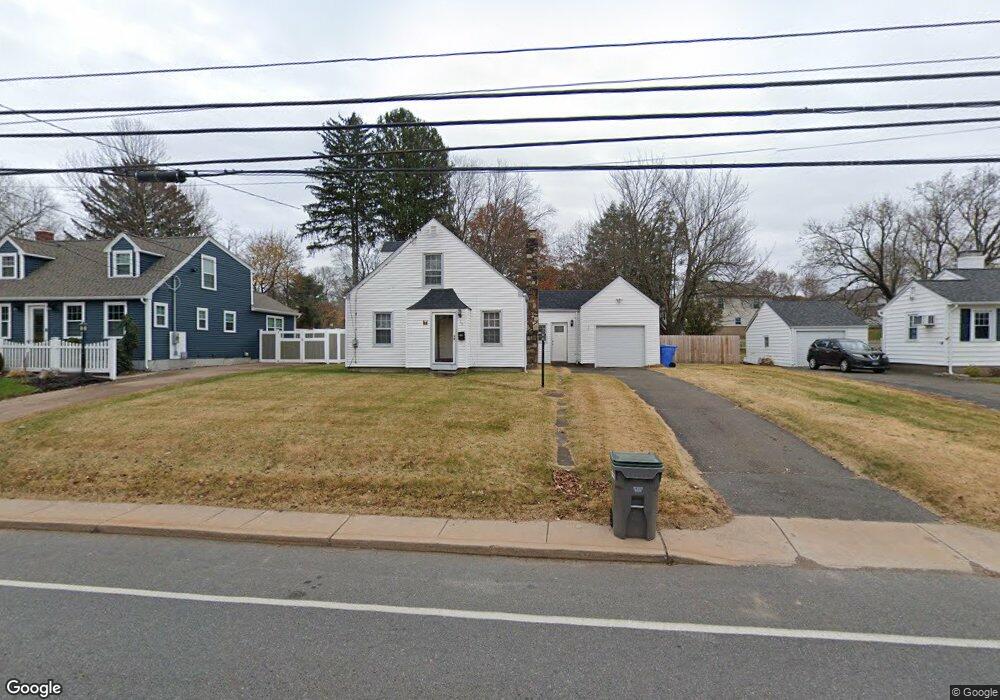
59 Vernon St Manchester, CT 06042
Buckley District NeighborhoodEstimated Value: $291,000 - $315,758
3
Beds
1
Bath
1,275
Sq Ft
$239/Sq Ft
Est. Value
About This Home
This home is located at 59 Vernon St, Manchester, CT 06042 and is currently estimated at $304,440, approximately $238 per square foot. 59 Vernon St is a home located in Hartford County with nearby schools including Buckley School, Illing Middle School, and Elisabeth M. Bennet Academy.
Ownership History
Date
Name
Owned For
Owner Type
Purchase Details
Closed on
May 21, 2008
Sold by
Indymac Bank Fsb
Bought by
Ortiz Gladys L
Current Estimated Value
Home Financials for this Owner
Home Financials are based on the most recent Mortgage that was taken out on this home.
Original Mortgage
$155,558
Outstanding Balance
$98,823
Interest Rate
5.94%
Estimated Equity
$205,617
Purchase Details
Closed on
Sep 15, 1997
Sold by
Crowley Nora Est
Bought by
Raill Michael F and Raill Stacy L
Create a Home Valuation Report for This Property
The Home Valuation Report is an in-depth analysis detailing your home's value as well as a comparison with similar homes in the area
Home Values in the Area
Average Home Value in this Area
Purchase History
| Date | Buyer | Sale Price | Title Company |
|---|---|---|---|
| Ortiz Gladys L | $158,000 | -- | |
| Ortiz Gladys L | $158,000 | -- | |
| Raill Michael F | $98,000 | -- | |
| Raill Michael F | $98,000 | -- |
Source: Public Records
Mortgage History
| Date | Status | Borrower | Loan Amount |
|---|---|---|---|
| Open | Raill Michael F | $155,558 | |
| Closed | Raill Michael F | $12,000 |
Source: Public Records
Tax History Compared to Growth
Tax History
| Year | Tax Paid | Tax Assessment Tax Assessment Total Assessment is a certain percentage of the fair market value that is determined by local assessors to be the total taxable value of land and additions on the property. | Land | Improvement |
|---|---|---|---|---|
| 2025 | $5,662 | $142,200 | $39,300 | $102,900 |
| 2024 | $5,500 | $142,200 | $39,300 | $102,900 |
| 2023 | $5,290 | $142,200 | $39,300 | $102,900 |
| 2022 | $5,136 | $142,200 | $39,300 | $102,900 |
| 2021 | $4,453 | $106,200 | $33,700 | $72,500 |
| 2020 | $4,447 | $106,200 | $33,700 | $72,500 |
| 2019 | $4,429 | $106,200 | $33,700 | $72,500 |
| 2018 | $4,345 | $106,200 | $33,700 | $72,500 |
| 2017 | $4,221 | $106,200 | $33,700 | $72,500 |
| 2016 | $4,444 | $112,000 | $42,800 | $69,200 |
| 2015 | $4,413 | $112,000 | $42,800 | $69,200 |
| 2014 | $4,329 | $112,000 | $42,800 | $69,200 |
Source: Public Records
Map
Nearby Homes