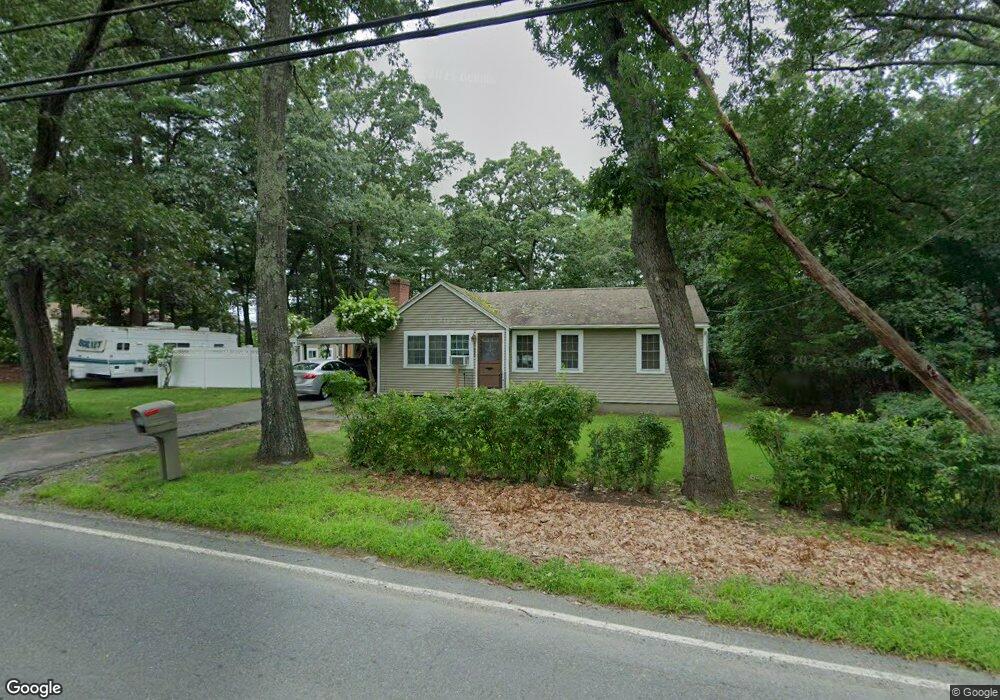
590 South St Tewksbury, MA 01876
Estimated Value: $554,000 - $635,000
3
Beds
1
Bath
1,058
Sq Ft
$556/Sq Ft
Est. Value
About This Home
This home is located at 590 South St, Tewksbury, MA 01876 and is currently estimated at $587,934, approximately $555 per square foot. 590 South St is a home located in Middlesex County with nearby schools including Heath-Brook Elementary School, John W. Wynn Middle School, and John F. Ryan Elementary School.
Ownership History
Date
Name
Owned For
Owner Type
Purchase Details
Closed on
Oct 2, 2006
Sold by
Eastman Anna Paula
Bought by
Eastman Mark R
Current Estimated Value
Home Financials for this Owner
Home Financials are based on the most recent Mortgage that was taken out on this home.
Original Mortgage
$271,000
Outstanding Balance
$162,247
Interest Rate
6.52%
Mortgage Type
Purchase Money Mortgage
Estimated Equity
$425,687
Purchase Details
Closed on
Dec 17, 2001
Sold by
Est Palma Frieda L and Wicks Anna M
Bought by
Eastman Mark and Eastman Ana Paula
Home Financials for this Owner
Home Financials are based on the most recent Mortgage that was taken out on this home.
Original Mortgage
$247,500
Interest Rate
6.6%
Mortgage Type
Purchase Money Mortgage
Create a Home Valuation Report for This Property
The Home Valuation Report is an in-depth analysis detailing your home's value as well as a comparison with similar homes in the area
Home Values in the Area
Average Home Value in this Area
Purchase History
| Date | Buyer | Sale Price | Title Company |
|---|---|---|---|
| Eastman Mark R | -- | -- | |
| Eastman Mark | $247,500 | -- |
Source: Public Records
Mortgage History
| Date | Status | Borrower | Loan Amount |
|---|---|---|---|
| Open | Eastman Mark R | $271,000 | |
| Previous Owner | Eastman Mark | $247,500 |
Source: Public Records
Tax History Compared to Growth
Tax History
| Year | Tax Paid | Tax Assessment Tax Assessment Total Assessment is a certain percentage of the fair market value that is determined by local assessors to be the total taxable value of land and additions on the property. | Land | Improvement |
|---|---|---|---|---|
| 2025 | $6,925 | $523,800 | $305,400 | $218,400 |
| 2024 | $6,672 | $498,300 | $291,000 | $207,300 |
| 2023 | $6,542 | $464,000 | $264,400 | $199,600 |
| 2022 | $6,446 | $424,100 | $230,000 | $194,100 |
| 2021 | $6,093 | $387,600 | $209,100 | $178,500 |
| 2020 | $5,869 | $367,500 | $199,100 | $168,400 |
| 2019 | $5,527 | $348,900 | $189,500 | $159,400 |
| 2018 | $5,149 | $319,200 | $189,500 | $129,700 |
| 2017 | $4,898 | $300,300 | $189,500 | $110,800 |
| 2016 | $4,750 | $290,500 | $189,500 | $101,000 |
| 2015 | $4,500 | $274,900 | $183,800 | $91,100 |
| 2014 | $4,197 | $260,500 | $183,800 | $76,700 |
Source: Public Records
Map
Nearby Homes