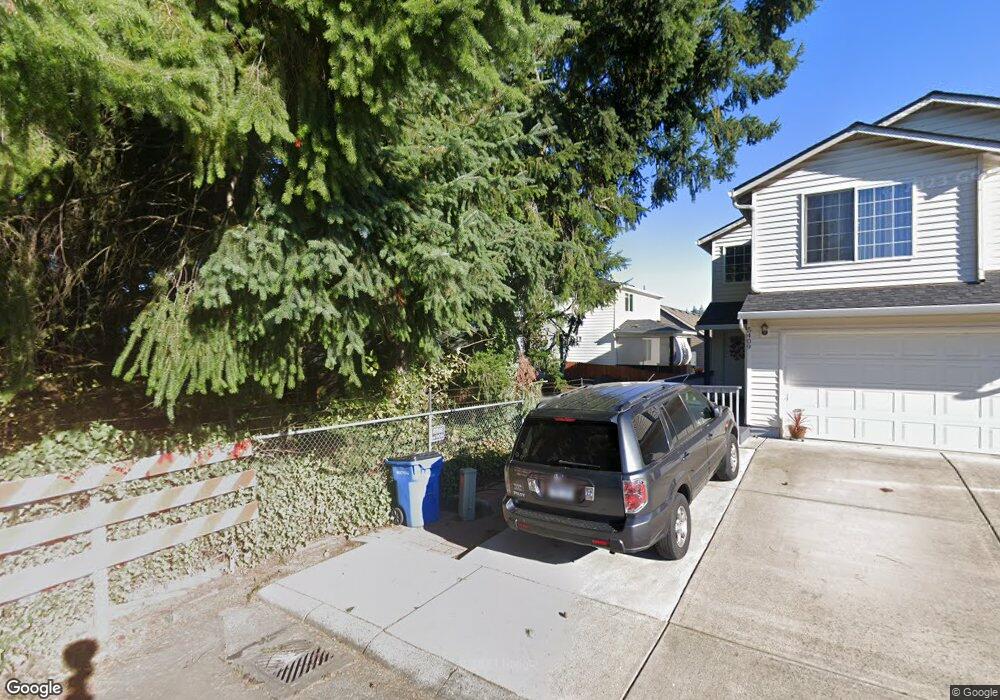
5905 NE 56th Cir Unit 19 Vancouver, WA 98661
Minnehaha NeighborhoodEstimated Value: $483,000 - $516,000
4
Beds
3
Baths
1,840
Sq Ft
$273/Sq Ft
Est. Value
About This Home
This home is located at 5905 NE 56th Cir Unit 19, Vancouver, WA 98661 and is currently estimated at $502,509, approximately $273 per square foot. 5905 NE 56th Cir Unit 19 is a home located in Clark County with nearby schools including Minnehaha Elementary School, Jason Lee Middle School, and Hudson's Bay High School.
Ownership History
Date
Name
Owned For
Owner Type
Purchase Details
Closed on
Feb 20, 2019
Sold by
Avery Emma Inc
Bought by
Blackwood Jorge Alonso and Bembry-Blackwood Robin Renee
Current Estimated Value
Home Financials for this Owner
Home Financials are based on the most recent Mortgage that was taken out on this home.
Original Mortgage
$311,370
Outstanding Balance
$273,192
Interest Rate
4.4%
Mortgage Type
New Conventional
Estimated Equity
$229,317
Purchase Details
Closed on
Jun 25, 2018
Sold by
Axford Lane Llc
Bought by
Avery Emma Inc
Home Financials for this Owner
Home Financials are based on the most recent Mortgage that was taken out on this home.
Original Mortgage
$240,000
Interest Rate
4.6%
Mortgage Type
Construction
Create a Home Valuation Report for This Property
The Home Valuation Report is an in-depth analysis detailing your home's value as well as a comparison with similar homes in the area
Home Values in the Area
Average Home Value in this Area
Purchase History
| Date | Buyer | Sale Price | Title Company |
|---|---|---|---|
| Blackwood Jorge Alonso | $321,000 | Fidelity Natl Title Vancouve | |
| Avery Emma Inc | $106,000 | Chicago Title Vancouver |
Source: Public Records
Mortgage History
| Date | Status | Borrower | Loan Amount |
|---|---|---|---|
| Open | Blackwood Jorge Alonso | $311,370 | |
| Previous Owner | Avery Emma Inc | $240,000 |
Source: Public Records
Tax History Compared to Growth
Tax History
| Year | Tax Paid | Tax Assessment Tax Assessment Total Assessment is a certain percentage of the fair market value that is determined by local assessors to be the total taxable value of land and additions on the property. | Land | Improvement |
|---|---|---|---|---|
| 2025 | $4,593 | $477,323 | $155,904 | $321,419 |
| 2024 | $4,535 | $460,362 | $155,904 | $304,458 |
| 2023 | $4,356 | $478,906 | $147,840 | $331,066 |
| 2022 | $4,061 | $461,406 | $155,904 | $305,502 |
| 2021 | $3,693 | $393,412 | $134,400 | $259,012 |
| 2020 | $3,392 | $335,494 | $87,500 | $247,994 |
| 2019 | $1,058 | $317,066 | $76,500 | $240,566 |
| 2018 | $766 | $98,990 | $0 | $0 |
| 2017 | $639 | $60,500 | $0 | $0 |
| 2016 | $654 | $52,500 | $0 | $0 |
| 2015 | $742 | $50,000 | $0 | $0 |
| 2014 | -- | $53,820 | $0 | $0 |
| 2013 | -- | $46,800 | $0 | $0 |
Source: Public Records
Map
Nearby Homes
- 6007 NE 55th Cir
- 5517 NE 61st Ct
- 0 NE 56th Ave
- 5503 NE 53rd Cir
- 5616 NE 59th Way
- 5415 NE 52nd St
- 6314 NE 58th St
- 5320 NE 54th St
- 5403 NE 65th Place
- Magnolia Plan at Cottages at 66th
- Laurel Plan at Cottages at 66th
- 5415 NE 65th Place
- 5505 NE 65th Place
- 5407 NE 65th Place
- 5419 NE 65th Place
- 5411 NE 65th Place
- 5412 NE 66th Ave
- 5310 NE 53rd Ct
- 6510 NE 52nd St
- 5408 NE 66th Ave
- 5905 NE 56th Cir
- 5909 NE 56th Cir
- 5409 NE 58th Place
- 5901 NE 56th Cir
- 5405 NE 58th Place
- 5408 NE 59th Ct
- 5913 NE 56th Cir
- 5420 NE 60th Ct
- 5812 NE 54th St
- 5816 NE 54th St
- 5416 NE 60th Ct
- 5820 NE 54th St
- 5900 NE 56th Cir
- 5917 NE 56th Cir
- 5904 NE 56th Cir
- 5806 NE 54th St
- 5908 NE 56th Cir
- 5822 NE 54th St
- 5407 NE 59th Ct
- 5412 NE 60th Ct