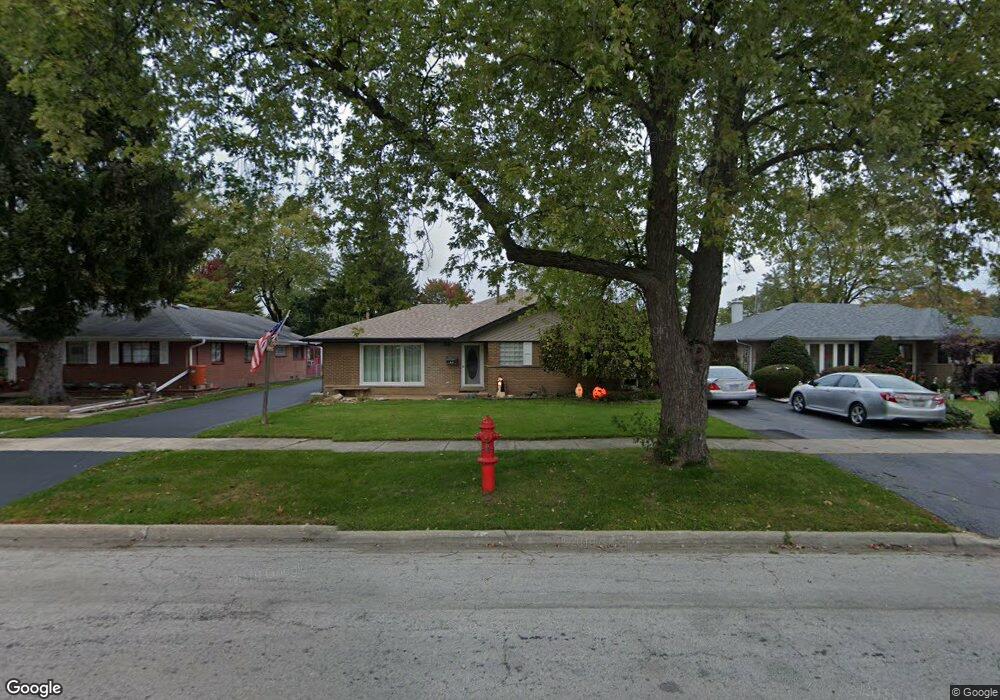
5930 110th St Chicago Ridge, IL 60415
Estimated Value: $358,000 - $381,000
4
Beds
2
Baths
2,006
Sq Ft
$183/Sq Ft
Est. Value
About This Home
This home is located at 5930 110th St, Chicago Ridge, IL 60415 and is currently estimated at $366,128, approximately $182 per square foot. 5930 110th St is a home located in Cook County with nearby schools including Ridge Central Elementary School, Elden D Finley Jr High School, and Harold L. Richards High School.
Ownership History
Date
Name
Owned For
Owner Type
Purchase Details
Closed on
May 20, 2022
Sold by
Cosman Robertm M and Cosman Denise M
Bought by
Robert M Cosman Trust and Denise M Cosman Trust
Current Estimated Value
Purchase Details
Closed on
May 17, 2022
Sold by
Cosman Denise M and Cosman Robert M
Bought by
Denise M Cosman Trust and Robert M Cosman Trust
Purchase Details
Closed on
Apr 16, 2004
Sold by
Langer Paul A and Langer Linda L
Bought by
Cosman Robert M and Cosman Denise M
Home Financials for this Owner
Home Financials are based on the most recent Mortgage that was taken out on this home.
Original Mortgage
$228,000
Interest Rate
5.91%
Mortgage Type
Unknown
Purchase Details
Closed on
Dec 6, 2000
Sold by
Cole Taylor Bank
Bought by
Langer Paul A and Langer Linda L
Home Financials for this Owner
Home Financials are based on the most recent Mortgage that was taken out on this home.
Original Mortgage
$166,400
Interest Rate
7.8%
Create a Home Valuation Report for This Property
The Home Valuation Report is an in-depth analysis detailing your home's value as well as a comparison with similar homes in the area
Home Values in the Area
Average Home Value in this Area
Purchase History
| Date | Buyer | Sale Price | Title Company |
|---|---|---|---|
| Robert M Cosman Trust | -- | New Title Company Name | |
| Denise M Cosman Trust | -- | -- | |
| Cosman Robert M | $285,000 | Stewart Title Of Illinois | |
| Langer Paul A | -- | -- |
Source: Public Records
Mortgage History
| Date | Status | Borrower | Loan Amount |
|---|---|---|---|
| Previous Owner | Cosman Robert M | $228,000 | |
| Previous Owner | Langer Paul A | $166,400 | |
| Closed | Cosman Robert M | $42,750 |
Source: Public Records
Tax History Compared to Growth
Tax History
| Year | Tax Paid | Tax Assessment Tax Assessment Total Assessment is a certain percentage of the fair market value that is determined by local assessors to be the total taxable value of land and additions on the property. | Land | Improvement |
|---|---|---|---|---|
| 2024 | $8,655 | $30,000 | $7,069 | $22,931 |
| 2023 | $6,960 | $30,000 | $7,069 | $22,931 |
| 2022 | $6,960 | $21,184 | $6,185 | $14,999 |
| 2021 | $6,693 | $21,183 | $6,185 | $14,998 |
| 2020 | $6,695 | $21,183 | $6,185 | $14,998 |
| 2019 | $7,215 | $21,907 | $5,595 | $16,312 |
| 2018 | $6,859 | $21,907 | $5,595 | $16,312 |
| 2017 | $6,893 | $21,907 | $5,595 | $16,312 |
| 2016 | $6,555 | $18,928 | $4,712 | $14,216 |
| 2015 | $6,381 | $18,928 | $4,712 | $14,216 |
| 2014 | $6,269 | $18,928 | $4,712 | $14,216 |
| 2013 | $6,728 | $21,931 | $4,712 | $17,219 |
Source: Public Records
Map
Nearby Homes
- 5924 W 109th St
- 10925 Mcvicker Ave
- 5825 109th St
- 10925 Lyman Ave
- 6040 111th St
- 10755 Mason Ave
- 11013 Menard Ave
- 10854 Lyman Ave
- 10937 Moody Ave
- 10832 Massasoit Ave
- 5730 110th St
- 5810 107th Court Way
- 10930 Central Ave Unit 1B
- 11000 Central Ave Unit 2C
- 11010 Central Ave Unit 3A
- 10912 Princess Ave
- 10706 Oak Ave
- 10825 Oxford Ave
- 10710 Central Ave Unit 3D
- 10529 Lyman Ave
- 5924 110th St
- 5936 110th St
- 5918 110th St
- 5942 110th St
- 5925 109th Place
- 5919 109th Place
- 5931 109th Place
- 5912 110th St
- 11000 Mason Ave
- 11001 Mason Ave
- 5913 109th Place
- 10943 Austin Ave
- 10949 Austin Ave
- 10937 Austin Ave
- 5906 110th St
- 11004 Mason Ave
- 10925 Austin Ave
- 11005 Mason Ave
- 5937 109th Place
- 5907 109th Place