Estimated Value: $656,000 - $778,000
3
Beds
2
Baths
1,375
Sq Ft
$513/Sq Ft
Est. Value
About This Home
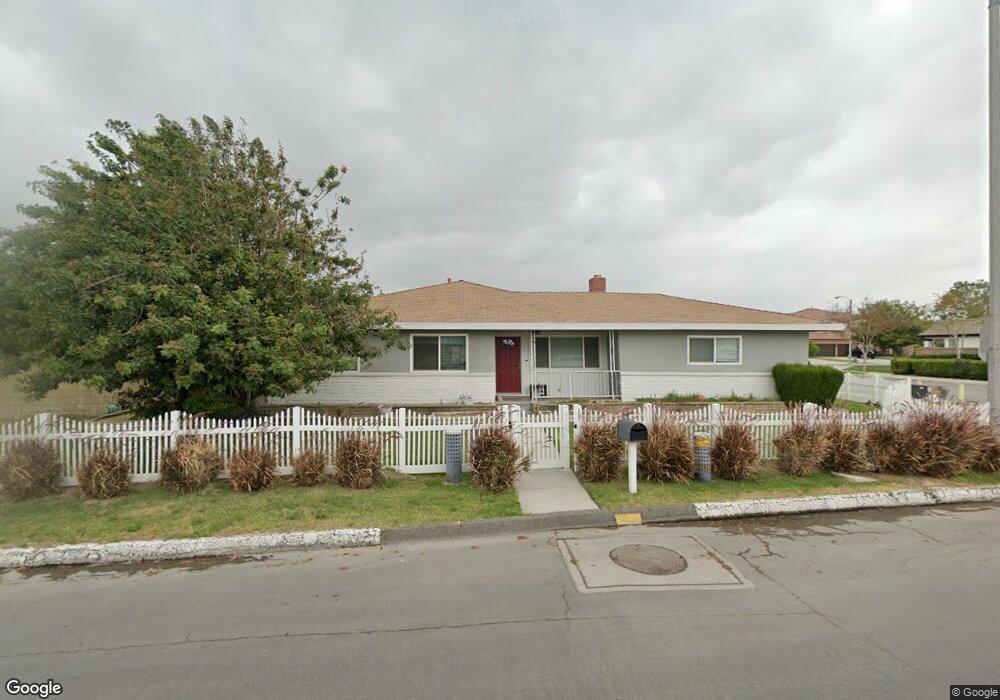
This home is located at 5934 Chino Ave, Chino, CA 91710 and is currently estimated at $704,912, approximately $512 per square foot. 5934 Chino Ave is a home located in San Bernardino County with nearby schools including Alicia Cortez Elementary, Magnolia Junior High, and Chino High School.
Ownership History
Date
Name
Owned For
Owner Type
Purchase Details
Closed on
May 16, 2018
Sold by
Smith Kim M
Bought by
Smith Kim M and The Kim M Smith Trust
Current Estimated Value
Purchase Details
Closed on
Jan 10, 2011
Sold by
Smith Kim M
Bought by
Smith Douglas G and Smith Kim M
Purchase Details
Closed on
Jun 30, 2003
Sold by
Gebhard Richard J
Bought by
Gebhard Richard J and Gebhard Bypass Trust
Purchase Details
Closed on
Mar 3, 2003
Sold by
Gebhard Richard J
Bought by
Gebhard Richard J and The Gebhard Bypass Trust
Purchase Details
Closed on
Aug 27, 2001
Sold by
Gebhard Richard J and Gebhard Doris J
Bought by
Gebhard Richard J and Gebhard Doris J
Purchase Details
Closed on
Jul 28, 1999
Sold by
Gebhard Richard J
Bought by
Gebhard Richard J and Gebhard Doris J
Create a Home Valuation Report for This Property
The Home Valuation Report is an in-depth analysis detailing your home's value as well as a comparison with similar homes in the area
Home Values in the Area
Average Home Value in this Area
Purchase History
| Date | Buyer | Sale Price | Title Company |
|---|---|---|---|
| Smith Kim M | -- | None Available | |
| Smith Kim M | -- | None Available | |
| Smith Douglas G | -- | None Available | |
| Smith Douglas G | -- | None Available | |
| Gebhard Richard J | -- | Fidelity | |
| Gebhard Richard J | -- | -- | |
| Gebhard Richard J | -- | -- | |
| Gebhard Richard J | -- | -- |
Source: Public Records
Tax History Compared to Growth
Tax History
| Year | Tax Paid | Tax Assessment Tax Assessment Total Assessment is a certain percentage of the fair market value that is determined by local assessors to be the total taxable value of land and additions on the property. | Land | Improvement |
|---|---|---|---|---|
| 2025 | $1,631 | $148,334 | $23,980 | $124,354 |
| 2024 | $1,631 | $145,426 | $23,510 | $121,916 |
| 2023 | $1,587 | $142,574 | $23,049 | $119,525 |
| 2022 | $1,577 | $139,778 | $22,597 | $117,181 |
| 2021 | $1,547 | $137,037 | $22,154 | $114,883 |
| 2020 | $3,886 | $135,632 | $21,927 | $113,705 |
| 2019 | $1,501 | $132,972 | $21,497 | $111,475 |
| 2018 | $1,468 | $130,364 | $21,075 | $109,289 |
| 2017 | $1,442 | $127,808 | $20,662 | $107,146 |
| 2016 | $1,349 | $125,302 | $20,257 | $105,045 |
| 2015 | $1,322 | $123,420 | $19,953 | $103,467 |
| 2014 | $1,296 | $121,002 | $19,562 | $101,440 |
Source: Public Records
Map
Nearby Homes
- 6031 Rosa Ct
- 13536 Sycamore Ln
- 12951 Red Cedar Way
- 5925 Riverside Dr Unit 12
- 13555 Magnolia Ave
- 12951 Benson Ave Unit 118
- 13014 Bermuda Ave
- 4610 Avondale Ct
- 11610 Granville Place
- 12936 Cambridge Ct
- 12811 Oaks Ave
- 12796 17th St
- 0 C St
- 5640 Riverside Dr Unit 119
- 6441 Susana St
- 12836 12th St Unit 27
- 13022 Cypress Ave
- 13006 Falcon Place
- 12947 Robin Ln
- 13775 Harvard Ave
- 13278 Sycamore Ave
- 13270 Sycamore Ave
- 13289 Oaks Ave
- 5945 Olvera Ct
- 13271 Oaks Ave
- 13262 Sycamore Ave
- 5953 Olvera Ct
- 5927 Chino Ave
- 5915 Chino Ave
- 5939 Chino Ave
- 13254 Sycamore Ave
- 5948 Olvera Ct
- 13263 Oaks Ave
- 13305 Oaks Ave
- 5951 Chino Ave
- 5956 Olvera Ct
- 13246 Sycamore Ave
- 13243 Oaks Ave
- 13280 Oaks Ave
- 13272 Oaks Ave