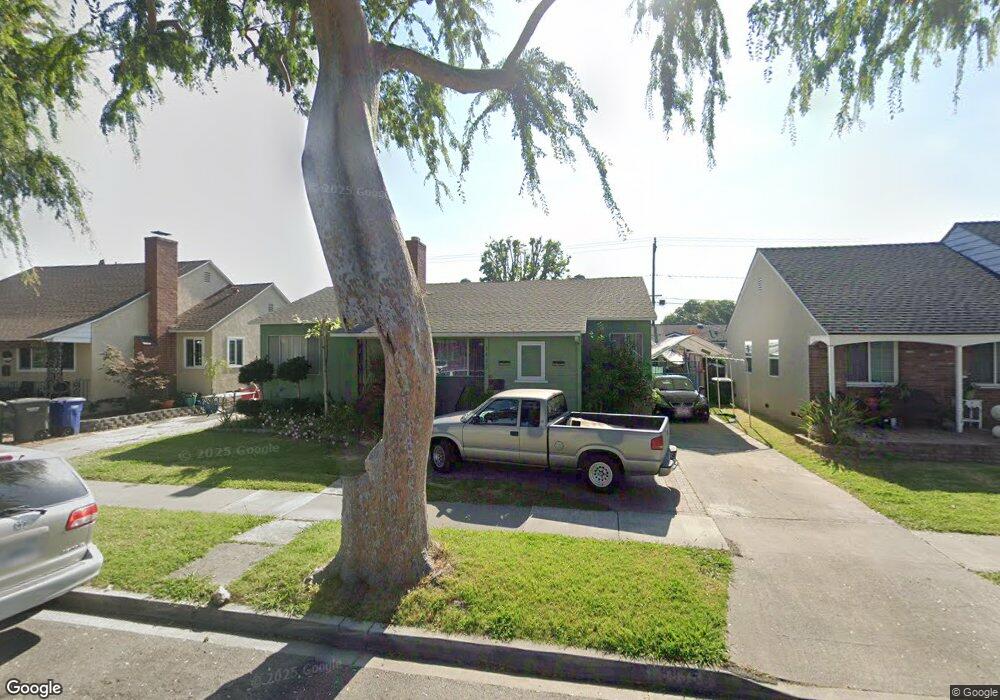
5935 Pimenta Ave Lakewood, CA 90712
Collins NeighborhoodEstimated Value: $793,758 - $886,000
3
Beds
1
Bath
1,158
Sq Ft
$719/Sq Ft
Est. Value
About This Home
This home is located at 5935 Pimenta Ave, Lakewood, CA 90712 and is currently estimated at $832,690, approximately $719 per square foot. 5935 Pimenta Ave is a home located in Los Angeles County with nearby schools including Captain Raymond Collins School, Leona Jackson Middle School, and Buena Vista High School.
Ownership History
Date
Name
Owned For
Owner Type
Purchase Details
Closed on
Feb 12, 2008
Sold by
Siwapinyoyos Mukda
Bought by
Siwapinyoyos Mukda
Current Estimated Value
Purchase Details
Closed on
Jun 5, 2003
Sold by
Siwapinyoyos Pichai
Bought by
Siwapinyoyos Mukda
Home Financials for this Owner
Home Financials are based on the most recent Mortgage that was taken out on this home.
Original Mortgage
$200,000
Interest Rate
5.61%
Mortgage Type
Purchase Money Mortgage
Purchase Details
Closed on
Jan 4, 2002
Sold by
Sewa Peter and Siwapinyoyos Pichai
Bought by
Siwapinyoyos Mukda
Home Financials for this Owner
Home Financials are based on the most recent Mortgage that was taken out on this home.
Original Mortgage
$160,000
Interest Rate
7.01%
Mortgage Type
Purchase Money Mortgage
Create a Home Valuation Report for This Property
The Home Valuation Report is an in-depth analysis detailing your home's value as well as a comparison with similar homes in the area
Home Values in the Area
Average Home Value in this Area
Purchase History
| Date | Buyer | Sale Price | Title Company |
|---|---|---|---|
| Siwapinyoyos Mukda | -- | Accommodation | |
| Siwapinyoyos Mukda | -- | Fidelity National Title Co | |
| Siwapinyoyos Mukda | -- | Landsafe Title |
Source: Public Records
Mortgage History
| Date | Status | Borrower | Loan Amount |
|---|---|---|---|
| Closed | Siwapinyoyos Mukda | $200,000 | |
| Closed | Siwapinyoyos Mukda | $160,000 |
Source: Public Records
Tax History Compared to Growth
Tax History
| Year | Tax Paid | Tax Assessment Tax Assessment Total Assessment is a certain percentage of the fair market value that is determined by local assessors to be the total taxable value of land and additions on the property. | Land | Improvement |
|---|---|---|---|---|
| 2025 | $2,017 | $128,596 | $72,228 | $56,368 |
| 2024 | $2,017 | $126,075 | $70,812 | $55,263 |
| 2023 | $1,976 | $123,604 | $69,424 | $54,180 |
| 2022 | $1,919 | $121,181 | $68,063 | $53,118 |
| 2021 | $1,867 | $118,806 | $66,729 | $52,077 |
| 2019 | $1,896 | $115,284 | $64,750 | $50,534 |
| 2018 | $1,738 | $113,025 | $63,481 | $49,544 |
| 2016 | $1,567 | $108,638 | $61,017 | $47,621 |
| 2015 | $1,491 | $107,007 | $60,101 | $46,906 |
| 2014 | $1,525 | $104,912 | $58,924 | $45,988 |
Source: Public Records
Map
Nearby Homes
- 4342 Arabella St
- 6034 Pepperwood Ave
- 6062 Pimenta Ave
- 3806 E Arabella St
- 5944 Blackthorne Ave
- 5672 Pepperwood Ave
- 6142 Oliva Ave
- 3711 E Hedda St
- 5839 Faculty Ave
- 4814 Hedda St
- 6107 Faculty Ave
- 6023 Whitewood Ave
- 5602 Verdura Ave
- 17820 Lakewood Blvd Unit 30
- 17820 Lakewood Blvd Unit 3
- 9112 Cedar St
- 9253 Rose St
- 6324 Johnson Ave
- 5503 Sunfield Ave
- 5817 Fidler Ave
- 5941 Pimenta Ave
- 5931 Pimenta Ave
- 5945 Pimenta Ave
- 5925 Pimenta Ave
- 5936 Oliva Ave
- 5942 Oliva Ave
- 5932 Oliva Ave
- 5948 Oliva Ave
- 5926 Oliva Ave
- 5951 Pimenta Ave
- 5921 Pimenta Ave
- 5934 Pimenta Ave
- 5940 Pimenta Ave
- 5930 Pimenta Ave
- 5952 Oliva Ave
- 5922 Oliva Ave
- 5924 Pimenta Ave
- 5944 Pimenta Ave
- 5957 Pimenta Ave
- 5920 Pimenta Ave