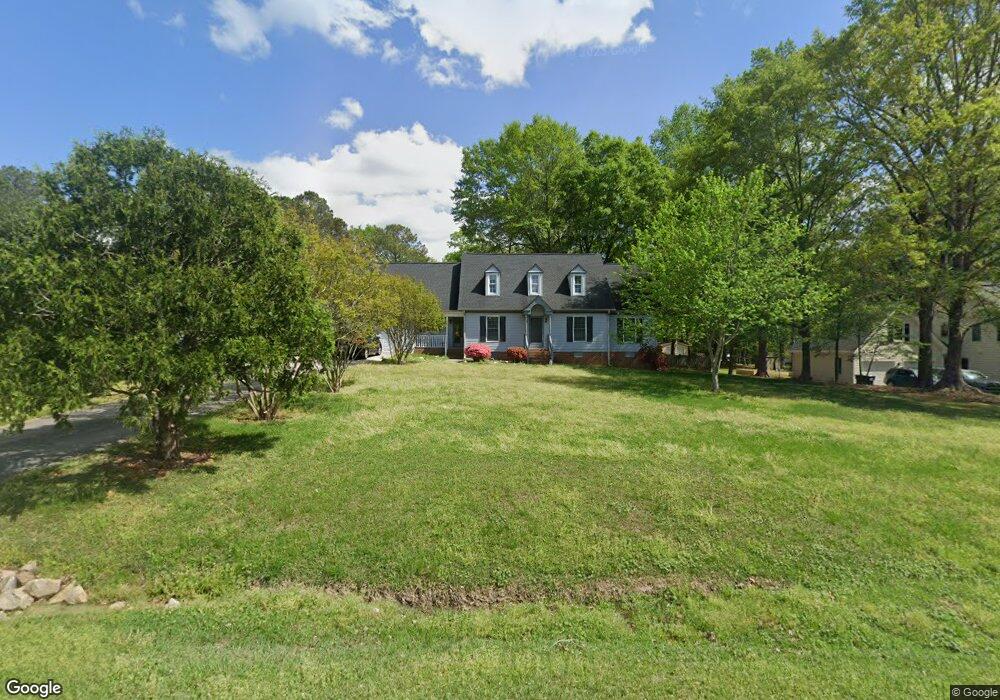
5941 Hampton Ridge Rd Raleigh, NC 27603
Estimated Value: $451,000 - $481,000
3
Beds
3
Baths
2,596
Sq Ft
$177/Sq Ft
Est. Value
About This Home
This home is located at 5941 Hampton Ridge Rd, Raleigh, NC 27603 and is currently estimated at $460,509, approximately $177 per square foot. 5941 Hampton Ridge Rd is a home located in Wake County with nearby schools including Rand Road Elementary, North Garner Middle, and Garner High.
Ownership History
Date
Name
Owned For
Owner Type
Purchase Details
Closed on
Feb 20, 2024
Sold by
Boivin Corey Alan
Bought by
King April R
Current Estimated Value
Purchase Details
Closed on
May 29, 2020
Sold by
Angelelli Kenneth V and Angelelli Bonnie Sue
Bought by
Boivin Corey Alan and King April R
Home Financials for this Owner
Home Financials are based on the most recent Mortgage that was taken out on this home.
Original Mortgage
$290,000
Interest Rate
3.3%
Mortgage Type
VA
Purchase Details
Closed on
Jul 27, 1999
Sold by
Callas George S
Bought by
Angelelli Kenneth and Angelelli Bonnie Sue
Home Financials for this Owner
Home Financials are based on the most recent Mortgage that was taken out on this home.
Original Mortgage
$140,625
Interest Rate
7.66%
Mortgage Type
Stand Alone First
Create a Home Valuation Report for This Property
The Home Valuation Report is an in-depth analysis detailing your home's value as well as a comparison with similar homes in the area
Home Values in the Area
Average Home Value in this Area
Purchase History
| Date | Buyer | Sale Price | Title Company |
|---|---|---|---|
| King April R | -- | None Listed On Document | |
| Boivin Corey Alan | $290,000 | None Available | |
| Angelelli Kenneth | $187,500 | -- |
Source: Public Records
Mortgage History
| Date | Status | Borrower | Loan Amount |
|---|---|---|---|
| Previous Owner | Boivin Corey Alan | $290,000 | |
| Previous Owner | Angelelli Kenneth | $140,625 |
Source: Public Records
Tax History Compared to Growth
Tax History
| Year | Tax Paid | Tax Assessment Tax Assessment Total Assessment is a certain percentage of the fair market value that is determined by local assessors to be the total taxable value of land and additions on the property. | Land | Improvement |
|---|---|---|---|---|
| 2025 | $2,572 | $398,943 | $80,000 | $318,943 |
| 2024 | $2,497 | $398,943 | $80,000 | $318,943 |
| 2023 | $2,188 | $278,005 | $56,000 | $222,005 |
| 2022 | $2,028 | $278,005 | $56,000 | $222,005 |
| 2021 | $1,974 | $278,005 | $56,000 | $222,005 |
| 2020 | $1,941 | $278,005 | $56,000 | $222,005 |
| 2019 | $1,861 | $225,372 | $56,000 | $169,372 |
| 2018 | $1,711 | $225,372 | $56,000 | $169,372 |
| 2017 | $1,622 | $225,372 | $56,000 | $169,372 |
| 2016 | $1,590 | $225,372 | $56,000 | $169,372 |
| 2015 | $1,686 | $239,921 | $56,000 | $183,921 |
| 2014 | $1,599 | $239,921 | $56,000 | $183,921 |
Source: Public Records
Map
Nearby Homes
- 1017 Azalea Garden Cir
- 1025 Azalea Garden Cir
- 1033 Azalea Garden Cir
- 1037 Azalea Garden Cir
- 1041 Azalea Garden Cir
- 1045 Azalea Garden Cir
- 1053 Azalea Garden Cir
- 1021 Wintu Ct
- 1057 Azalea Garden Cir
- 1061 Azalea Garden Cir
- 1065 Azalea Garden Cir
- 1069 Azalea Garden Cir
- 6501 Rock Service Station Rd
- 1005 Turner Meadow Dr
- 6600 Rock Service Station Rd
- 1220 Turner Woods Dr
- 6521 Camellia Creek Dr
- 1009 Feldmen Dr
- 936 Elbridge Dr
- 1017 Widgeon Way
- 5937 Hampton Ridge Rd
- 5945 Hampton Ridge Rd
- 6108 Wolverhampton Dr
- 6001 Hampton Ridge Rd
- 5933 Hampton Ridge Rd
- 5944 Hampton Ridge Rd
- 6104 Wolverhampton Dr
- 6120 Wolverhampton Dr
- 1701 Sunderland Ct
- 5936 Hampton Ridge Rd
- 6009 Hampton Ridge Rd
- 5929 Hampton Ridge Rd
- 6020 Wolverhampton Dr
- 1700 Sunderland Ct
- 6124 Wolverhampton Dr
- 5932 Hampton Ridge Rd
- 1709 Sunderland Ct
- 6109 Wolverhampton Dr
- 6016 Wolverhampton Dr
- 6008 Hampton Ridge Rd