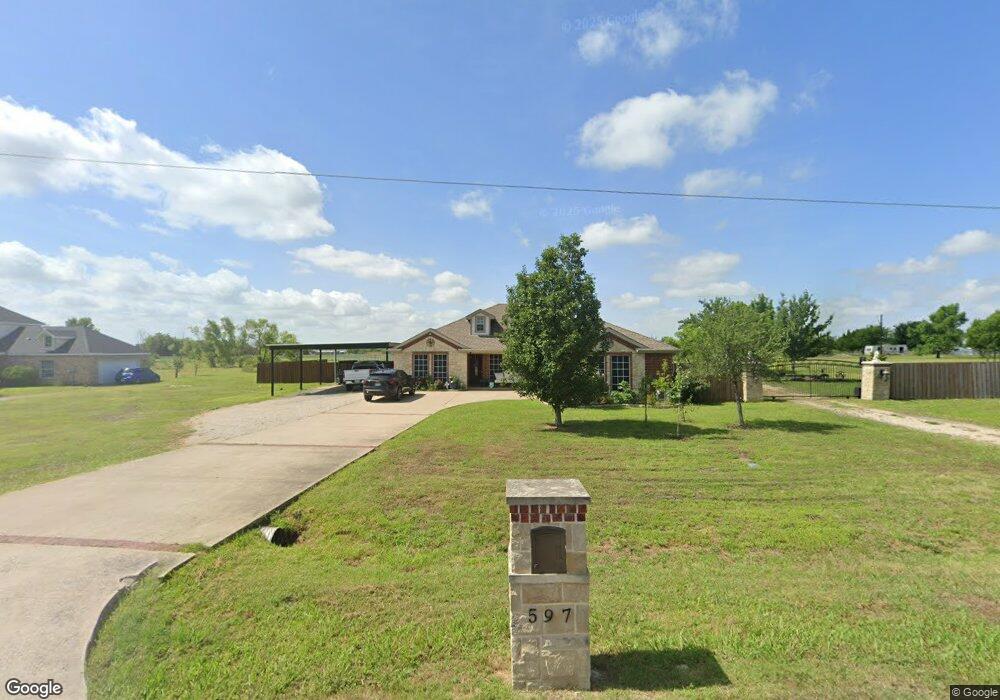
597 Eastridge Dr Royse City, TX 75189
Estimated Value: $413,000 - $545,000
4
Beds
2
Baths
2,064
Sq Ft
$229/Sq Ft
Est. Value
About This Home
This home is located at 597 Eastridge Dr, Royse City, TX 75189 and is currently estimated at $471,762, approximately $228 per square foot. 597 Eastridge Dr is a home located in Rockwall County with nearby schools including Maurine Cain Middle School and Rockwall-Heath High School.
Ownership History
Date
Name
Owned For
Owner Type
Purchase Details
Closed on
Jan 8, 2018
Sold by
Martinez Jose Aifredo and Martinez Mayra Esther
Bought by
Belarminio Yvonne and Belarminio Eugenio
Current Estimated Value
Home Financials for this Owner
Home Financials are based on the most recent Mortgage that was taken out on this home.
Original Mortgage
$269,920
Outstanding Balance
$234,943
Interest Rate
5.25%
Mortgage Type
FHA
Estimated Equity
$236,819
Purchase Details
Closed on
Jul 23, 2010
Sold by
Gonzalez Joe and Torres Laurie
Bought by
Martinez Jose Alfredo and Martinez Mayra Esther
Home Financials for this Owner
Home Financials are based on the most recent Mortgage that was taken out on this home.
Original Mortgage
$138,139
Interest Rate
4.69%
Mortgage Type
FHA
Purchase Details
Closed on
Aug 23, 2005
Sold by
Arellano Jesus and Axxis Homes
Bought by
Gonzalez Joe
Create a Home Valuation Report for This Property
The Home Valuation Report is an in-depth analysis detailing your home's value as well as a comparison with similar homes in the area
Home Values in the Area
Average Home Value in this Area
Purchase History
| Date | Buyer | Sale Price | Title Company |
|---|---|---|---|
| Belarminio Yvonne | -- | Lawyers Title | |
| Martinez Jose Alfredo | -- | Nat | |
| Gonzalez Joe | -- | None Available |
Source: Public Records
Mortgage History
| Date | Status | Borrower | Loan Amount |
|---|---|---|---|
| Open | Belarminio Yvonne | $269,920 | |
| Previous Owner | Martinez Jose Alfredo | $138,139 |
Source: Public Records
Tax History Compared to Growth
Tax History
| Year | Tax Paid | Tax Assessment Tax Assessment Total Assessment is a certain percentage of the fair market value that is determined by local assessors to be the total taxable value of land and additions on the property. | Land | Improvement |
|---|---|---|---|---|
| 2025 | $6,329 | $525,823 | $162,000 | $363,823 |
| 2023 | $6,329 | $473,900 | $168,750 | $305,150 |
| 2022 | $6,300 | $418,030 | $137,700 | $280,330 |
| 2021 | $5,406 | $333,060 | $130,000 | $203,060 |
| 2020 | $5,400 | $322,370 | $99,000 | $223,370 |
| 2019 | $4,816 | $273,860 | $68,500 | $205,360 |
| 2018 | $3,876 | $216,570 | $58,000 | $158,570 |
| 2017 | $4,019 | $218,330 | $58,000 | $160,330 |
| 2016 | $3,547 | $192,680 | $58,000 | $134,680 |
| 2015 | $3,054 | $162,140 | $26,010 | $136,130 |
| 2014 | $3,054 | $166,370 | $26,010 | $140,360 |
Source: Public Records
Map
Nearby Homes
- 2128 St Annes Blvd
- 656 Blakelys Way
- 308 American Elm Dr
- 310 American Elm Dr
- 312 American Elm Dr
- 244 Bassett Hall Rd
- 272 Bassett Hall Rd
- 268 Bassett Hall Rd
- 523 Grand Oak Dr
- 248 Golden Run Dr
- 528 Embargo Dr
- 616 Blakelys Way
- 132 Landon Trail
- 569 Baker Ct
- 510 Quapaw Mews
- 569 Baker Ct
- 732 Jamestown Ln
- 418 Bassett Hall Rd
- 250 Landon Trail
- Leaton - S4306 Plan at Edgewater
- 609 Eastridge Dr
- 572 Eastridge Dr
- 598 Eastridge Dr
- 542 Eastridge Dr
- 635 Eastridge Dr
- 516 Eastridge Dr
- 517 Eastridge Dr
- 487 Eastridge Dr
- 486 Eastridge Dr
- 880 Northfork Rd
- 459 Eastridge Dr
- 460 Eastridge Dr
- 421 Eastridge Dr
- 430 Eastridge Dr
- 734 Northfork Rd
- 986 Northfork Rd
- 397 Eastridge Dr
- 690 Northfork Rd
- 575 Northfork Rd
- EASTRIDGE EST, LOT 2 Eastridge Dr