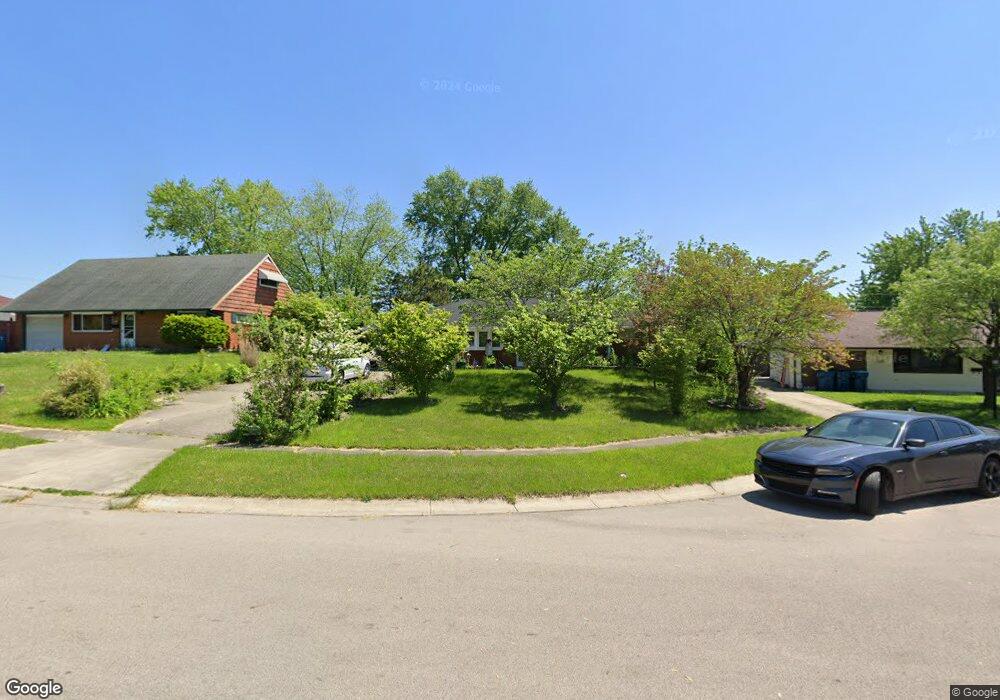
5986 Rena Place Dayton, OH 45424
Estimated Value: $189,584 - $208,000
3
Beds
2
Baths
1,340
Sq Ft
$149/Sq Ft
Est. Value
About This Home
This home is located at 5986 Rena Place, Dayton, OH 45424 and is currently estimated at $200,146, approximately $149 per square foot. 5986 Rena Place is a home located in Montgomery County with nearby schools including Wayne High School and Huber Heights Christian Academy.
Ownership History
Date
Name
Owned For
Owner Type
Purchase Details
Closed on
May 30, 2008
Sold by
Garrett Dayna M and Garrett Anthony J
Bought by
Shamblin Maria A
Current Estimated Value
Home Financials for this Owner
Home Financials are based on the most recent Mortgage that was taken out on this home.
Original Mortgage
$63,843
Outstanding Balance
$41,052
Interest Rate
6.09%
Mortgage Type
Purchase Money Mortgage
Estimated Equity
$159,095
Purchase Details
Closed on
Feb 6, 2006
Sold by
Showers Kirsten N and Showers Richard L
Bought by
Garrett Anthony J and Garrett Dayna M
Home Financials for this Owner
Home Financials are based on the most recent Mortgage that was taken out on this home.
Original Mortgage
$91,200
Interest Rate
8.95%
Mortgage Type
Purchase Money Mortgage
Purchase Details
Closed on
Mar 30, 2001
Sold by
Lampe Velma F
Bought by
Showers Kirsten N
Home Financials for this Owner
Home Financials are based on the most recent Mortgage that was taken out on this home.
Original Mortgage
$81,047
Interest Rate
7.13%
Mortgage Type
FHA
Create a Home Valuation Report for This Property
The Home Valuation Report is an in-depth analysis detailing your home's value as well as a comparison with similar homes in the area
Home Values in the Area
Average Home Value in this Area
Purchase History
| Date | Buyer | Sale Price | Title Company |
|---|---|---|---|
| Shamblin Maria A | $80,000 | Midwest Title Company | |
| Garrett Anthony J | $114,000 | Republic Title Agency Inc | |
| Showers Kirsten N | $82,400 | -- |
Source: Public Records
Mortgage History
| Date | Status | Borrower | Loan Amount |
|---|---|---|---|
| Open | Shamblin Maria A | $63,843 | |
| Previous Owner | Garrett Anthony J | $91,200 | |
| Previous Owner | Showers Kirsten N | $81,047 |
Source: Public Records
Tax History Compared to Growth
Tax History
| Year | Tax Paid | Tax Assessment Tax Assessment Total Assessment is a certain percentage of the fair market value that is determined by local assessors to be the total taxable value of land and additions on the property. | Land | Improvement |
|---|---|---|---|---|
| 2024 | $2,571 | $49,870 | $10,010 | $39,860 |
| 2023 | $2,571 | $49,870 | $10,010 | $39,860 |
| 2022 | $2,279 | $34,840 | $7,000 | $27,840 |
| 2021 | $2,312 | $34,840 | $7,000 | $27,840 |
| 2020 | $2,314 | $34,840 | $7,000 | $27,840 |
| 2019 | $2,151 | $28,610 | $7,000 | $21,610 |
| 2018 | $2,158 | $28,610 | $7,000 | $21,610 |
| 2017 | $2,144 | $28,610 | $7,000 | $21,610 |
| 2016 | $2,028 | $26,360 | $7,000 | $19,360 |
| 2015 | $2,002 | $26,360 | $7,000 | $19,360 |
| 2014 | $2,002 | $26,360 | $7,000 | $19,360 |
| 2012 | -- | $27,350 | $8,750 | $18,600 |
Source: Public Records
Map
Nearby Homes
- 5912 Bavaria Place
- 5630 Botkins Rd
- 5455 Flotron Dr
- 5488 Flotron Dr
- 6100 Farmborough Dr
- 6109 Ansbury Dr
- 5159 Fishburg Rd
- 4918 Powell Rd
- 5732 Benedict Rd
- 5983 Harshmanville Rd
- 5625 Copley Cir
- 5685 Cottonwood Ct
- 4848 Rittenhouse Dr
- 5952 Tibet Dr
- 5004 Fishburg Rd
- 5455 Naughton Dr
- 4825 Nelapark Dr
- 5926 Chambersburg Rd
- 5431 Naughton Dr
- 5474 Bellefontaine Rd Unit 5468
- 5992 Rena Place
- 5980 Rena Place
- 5981 Rosalie Rd
- 5975 Rosalie Rd
- 5370 Fishburg Rd
- 5380 Fishburg Rd
- 5974 Rena Place
- 5969 Rosalie Rd
- 5985 Rena Place
- 5991 Rena Place
- 5989 Rosalie Rd
- 5979 Rena Place
- 5963 Rosalie Rd
- 5973 Rena Place
- 5360 Fishburg Rd
- 5933 Rosalie Rd
- 5929 Rosalie Rd
- 5947 Rosalie Rd
- 5988 Rosalie Rd
- 5927 Rosalie Rd