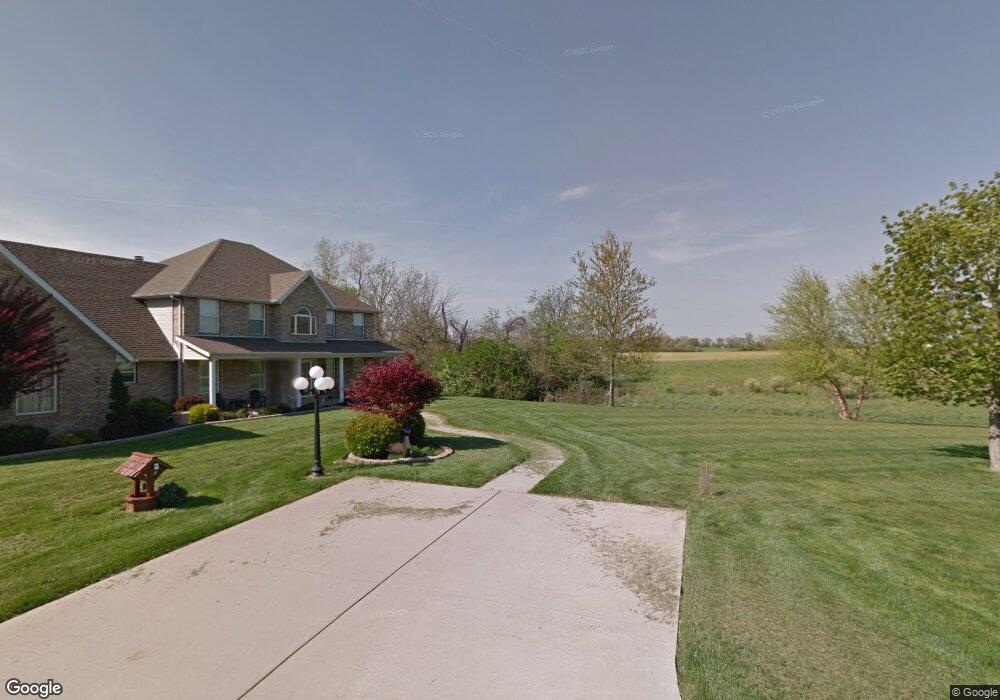
5990 Rolling Hills Ln Belleville, IL 62223
Estimated Value: $101,877 - $324,000
--
Bed
--
Bath
--
Sq Ft
2.54
Acres
About This Home
This home is located at 5990 Rolling Hills Ln, Belleville, IL 62223 and is currently estimated at $212,939. 5990 Rolling Hills Ln is a home located in St. Clair County with nearby schools including Millstadt Consolidated School, Millstadt Primary Center, and Our Lady Queen Of Peace Catholic School.
Ownership History
Date
Name
Owned For
Owner Type
Purchase Details
Closed on
Mar 18, 2022
Sold by
Budde John D and Budde Lynn A
Bought by
Budde John D and John D Budde Revocable Living Trust
Current Estimated Value
Purchase Details
Closed on
Oct 30, 2014
Sold by
Ford Corey and Ford Brittany
Bought by
Budde John D and Budde Lynn A
Purchase Details
Closed on
May 29, 2013
Sold by
Katz Michael A
Bought by
Ford Corey and Ford Brittany
Home Financials for this Owner
Home Financials are based on the most recent Mortgage that was taken out on this home.
Original Mortgage
$27,200
Interest Rate
3.95%
Mortgage Type
Purchase Money Mortgage
Purchase Details
Closed on
Jan 18, 2007
Sold by
Kapelski Kevin J and Kapelski Jennifer L
Bought by
Katz Michael A and Katz Katheryn M
Purchase Details
Closed on
Feb 25, 2005
Sold by
Schmidt Allen E and Schmidt Kathy J
Bought by
Kapelski Kevin J and Kapelski Jennifer L
Purchase Details
Closed on
Sep 27, 2001
Sold by
Keller Bryan and Keller Kelley
Bought by
Schmidt Allen E and Schmidt Kathy J
Create a Home Valuation Report for This Property
The Home Valuation Report is an in-depth analysis detailing your home's value as well as a comparison with similar homes in the area
Home Values in the Area
Average Home Value in this Area
Purchase History
| Date | Buyer | Sale Price | Title Company |
|---|---|---|---|
| Budde John D | -- | None Available | |
| Budde John D | $40,000 | Illinois Title & Escrow | |
| Ford Corey | $34,000 | Community Title Shiloh Llc | |
| Katz Michael A | $46,500 | Pti | |
| Kapelski Kevin J | $55,500 | Pti | |
| Schmidt Allen E | $37,500 | -- |
Source: Public Records
Mortgage History
| Date | Status | Borrower | Loan Amount |
|---|---|---|---|
| Previous Owner | Ford Corey | $27,200 |
Source: Public Records
Tax History Compared to Growth
Tax History
| Year | Tax Paid | Tax Assessment Tax Assessment Total Assessment is a certain percentage of the fair market value that is determined by local assessors to be the total taxable value of land and additions on the property. | Land | Improvement |
|---|---|---|---|---|
| 2024 | $2,001 | $28,061 | $7,328 | $20,733 |
| 2023 | $1,883 | $25,178 | $6,575 | $18,603 |
| 2022 | $1,787 | $22,847 | $5,966 | $16,881 |
| 2021 | $1,727 | $21,212 | $5,539 | $15,673 |
| 2020 | $1,644 | $19,667 | $5,388 | $14,279 |
| 2019 | $1,625 | $19,667 | $5,388 | $14,279 |
| 2018 | $1,328 | $15,872 | $5,149 | $10,723 |
| 2017 | $1,109 | $14,782 | $4,795 | $9,987 |
| 2016 | $930 | $11,239 | $1,752 | $9,487 |
| 2014 | $134 | $1,762 | $1,762 | $0 |
| 2013 | $34 | $1,880 | $1,880 | $0 |
Source: Public Records
Map
Nearby Homes
- 6009 Rolling Hills Ln
- 7400 Concordia Rd
- 1909 Menard Dr
- 1824 Menard Dr
- 7168 Mine Haul Rd
- 401 Pecan Ln
- 1374 Rocky Creek Ct
- 45 Fenwood Dr
- 1366 Radden Ct
- 1800 Roosevelt Ave
- 178 Wyndrose Estates Dr
- 1801 Roosevelt Ave
- 636 S 19th St
- 324 Lake Forest Dr
- 421 S 20th St
- 800 Springwood Dr
- 633 Springwood Dr
- 402 S 21st St
- 245 Summers Trace
- 318 S 20th St
- 6010 Rolling Hills Ln
- 5962 Rolling Hills Ln
- 5941 Rolling Hills Ln
- 4585 Frank Scott Pkwy W
- 4561 Frank Scott Pkwy W
- 4649 Frank Scott Pkwy W
- 6001 Concordia Rd
- 4616 Frank Scott Pkwy W
- 4710 Frank Scott Pkwy W
- 4734 Frank Scott Pkwy W
- 6000 Concordia Rd
- 6000 Concordia Rd
- 0 Concordia Church Rd Unit 16052544
- 0 Concordia Church Rd Unit 16052541
- 0 Concordia Church Rd Unit 17008184
- 4526 Frank Scott Pkwy W
- 4700 Frank Scott Pkwy W
- 5801 Concordia Rd
- 4534 Frank Scott Pkwy W
- 6400 Concordia Rd