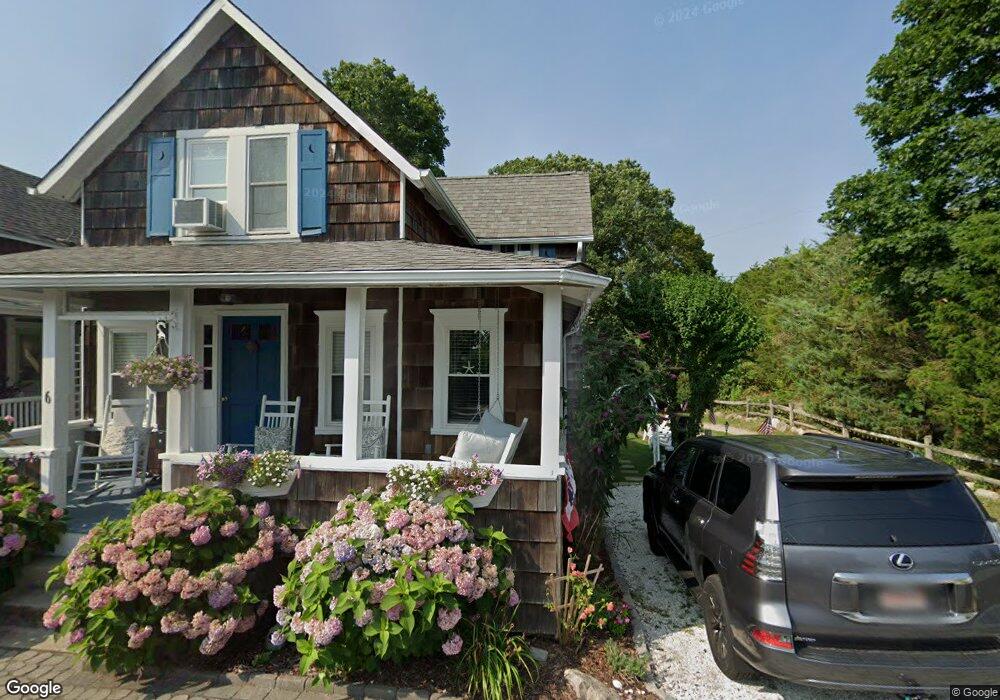
6 Alona Ave Bourne, MA 2532
Monument Beach NeighborhoodEstimated Value: $442,101 - $609,000
3
Beds
1
Bath
788
Sq Ft
$660/Sq Ft
Est. Value
About This Home
This home is located at 6 Alona Ave, Bourne, MA 2532 and is currently estimated at $520,025, approximately $659 per square foot. 6 Alona Ave is a home located in Barnstable County with nearby schools including Bourne High School, Cadence Academy Preschool - Bourne, and St Margaret Regional School.
Ownership History
Date
Name
Owned For
Owner Type
Purchase Details
Closed on
May 28, 2010
Sold by
Gerety Jacquelyn M and Gerety David
Bought by
Russell Richard F
Current Estimated Value
Home Financials for this Owner
Home Financials are based on the most recent Mortgage that was taken out on this home.
Original Mortgage
$252,100
Interest Rate
5.13%
Mortgage Type
Purchase Money Mortgage
Create a Home Valuation Report for This Property
The Home Valuation Report is an in-depth analysis detailing your home's value as well as a comparison with similar homes in the area
Home Values in the Area
Average Home Value in this Area
Purchase History
| Date | Buyer | Sale Price | Title Company |
|---|---|---|---|
| Russell Richard F | $250,000 | -- | |
| Russell Richard F | $250,000 | -- |
Source: Public Records
Mortgage History
| Date | Status | Borrower | Loan Amount |
|---|---|---|---|
| Open | Russell Richard F | $250,000 | |
| Closed | Russell Richard F | $252,100 | |
| Previous Owner | Russell Richard F | $150,000 | |
| Previous Owner | Russell Richard F | $40,000 |
Source: Public Records
Tax History Compared to Growth
Tax History
| Year | Tax Paid | Tax Assessment Tax Assessment Total Assessment is a certain percentage of the fair market value that is determined by local assessors to be the total taxable value of land and additions on the property. | Land | Improvement |
|---|---|---|---|---|
| 2025 | $2,965 | $379,700 | $210,300 | $169,400 |
| 2024 | $2,900 | $361,600 | $200,300 | $161,300 |
| 2023 | $2,980 | $338,300 | $195,500 | $142,800 |
| 2022 | $2,889 | $286,300 | $173,000 | $113,300 |
| 2021 | $2,806 | $260,500 | $157,400 | $103,100 |
| 2020 | $3,551 | $258,400 | $155,900 | $102,500 |
| 2019 | $3,151 | $299,800 | $203,100 | $96,700 |
| 2018 | $3,009 | $285,500 | $193,400 | $92,100 |
| 2017 | $2,689 | $279,400 | $188,200 | $91,200 |
| 2016 | $2,656 | $261,400 | $188,200 | $73,200 |
| 2015 | $2,632 | $261,400 | $188,200 | $73,200 |
Source: Public Records
Map
Nearby Homes