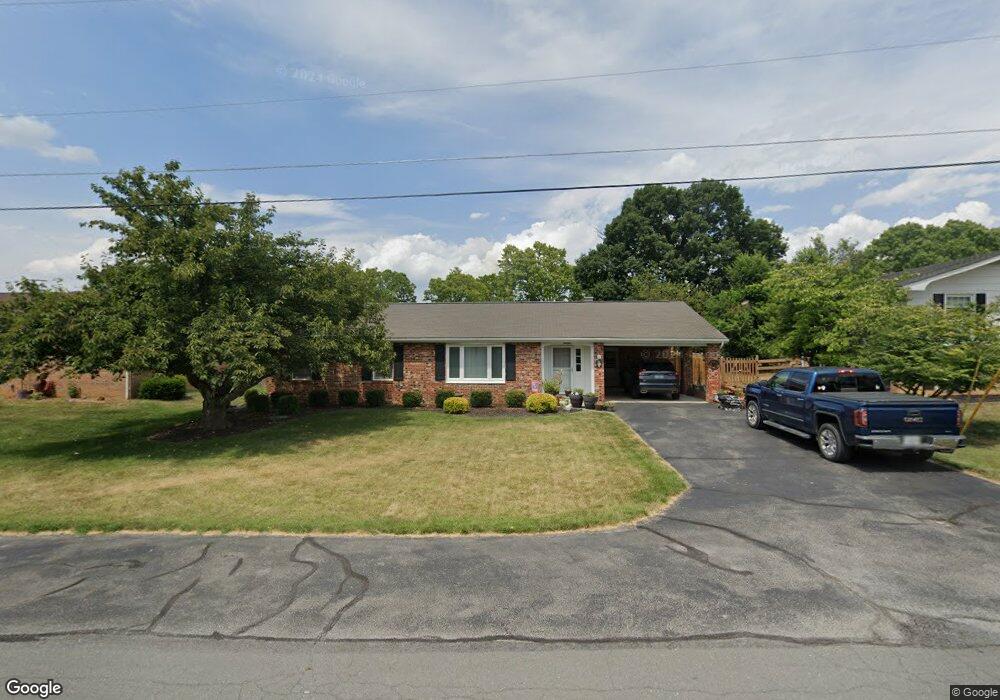
6 Bel Voi Dr Berryville, VA 22611
Estimated Value: $453,000 - $476,000
3
Beds
2
Baths
1,770
Sq Ft
$263/Sq Ft
Est. Value
About This Home
This home is located at 6 Bel Voi Dr, Berryville, VA 22611 and is currently estimated at $465,415, approximately $262 per square foot. 6 Bel Voi Dr is a home located in Clarke County with nearby schools including Clarke County High School.
Ownership History
Date
Name
Owned For
Owner Type
Purchase Details
Closed on
Aug 17, 2018
Sold by
Isgl Properties Llc
Bought by
Ginty Snyder Eileen and Ginty Brian Snyder
Current Estimated Value
Home Financials for this Owner
Home Financials are based on the most recent Mortgage that was taken out on this home.
Original Mortgage
$252,000
Outstanding Balance
$217,636
Interest Rate
4.25%
Mortgage Type
New Conventional
Estimated Equity
$247,779
Purchase Details
Closed on
Dec 4, 2017
Sold by
Snyder Brian Keith and Synder Michele Jean
Bought by
Isgl Properties Llc
Create a Home Valuation Report for This Property
The Home Valuation Report is an in-depth analysis detailing your home's value as well as a comparison with similar homes in the area
Home Values in the Area
Average Home Value in this Area
Purchase History
| Date | Buyer | Sale Price | Title Company |
|---|---|---|---|
| Ginty Snyder Eileen | $315,000 | Chicago Title | |
| Isgl Properties Llc | -- | -- |
Source: Public Records
Mortgage History
| Date | Status | Borrower | Loan Amount |
|---|---|---|---|
| Open | Ginty Snyder Eileen | $252,000 |
Source: Public Records
Tax History Compared to Growth
Tax History
| Year | Tax Paid | Tax Assessment Tax Assessment Total Assessment is a certain percentage of the fair market value that is determined by local assessors to be the total taxable value of land and additions on the property. | Land | Improvement |
|---|---|---|---|---|
| 2025 | $1,848 | $409,800 | $140,000 | $269,800 |
| 2024 | $1,613 | $268,900 | $85,000 | $183,900 |
| 2023 | $1,613 | $268,900 | $85,000 | $183,900 |
| 2022 | $1,640 | $268,900 | $85,000 | $183,900 |
| 2021 | $1,640 | $268,900 | $85,000 | $183,900 |
| 2020 | $1,419 | $268,900 | $85,000 | $183,900 |
| 2019 | $1,419 | $199,800 | $70,000 | $129,800 |
| 2018 | $1,419 | $199,800 | $70,000 | $129,800 |
| 2017 | $1,419 | $199,800 | $70,000 | $129,800 |
| 2016 | -- | $199,800 | $70,000 | $129,800 |
| 2015 | -- | $228,300 | $90,000 | $138,300 |
| 2014 | -- | $228,300 | $90,000 | $138,300 |
Source: Public Records
Map
Nearby Homes
- 409 Mccormick Ct
- 112 Treadwell St
- 22 Josephine St
- 0 O Howellsville Rd
- 0 Lot 17a1 Timber Ln
- 328 S Church St
- 000 Mcneill Dr
- 325 S Church St
- 218 Treadwell St
- 236 Walnut St
- 238 Walnut St
- 311 Breckinridge Ct
- 308 W Main St
- 529 S Church St
- 317 Henderson Ct
- 11 Lindey Ln
- Lot 1A Mosby Blvd
- 348 Tyson Dr
- 529 Mosby Blvd
- 337 Tyson Dr