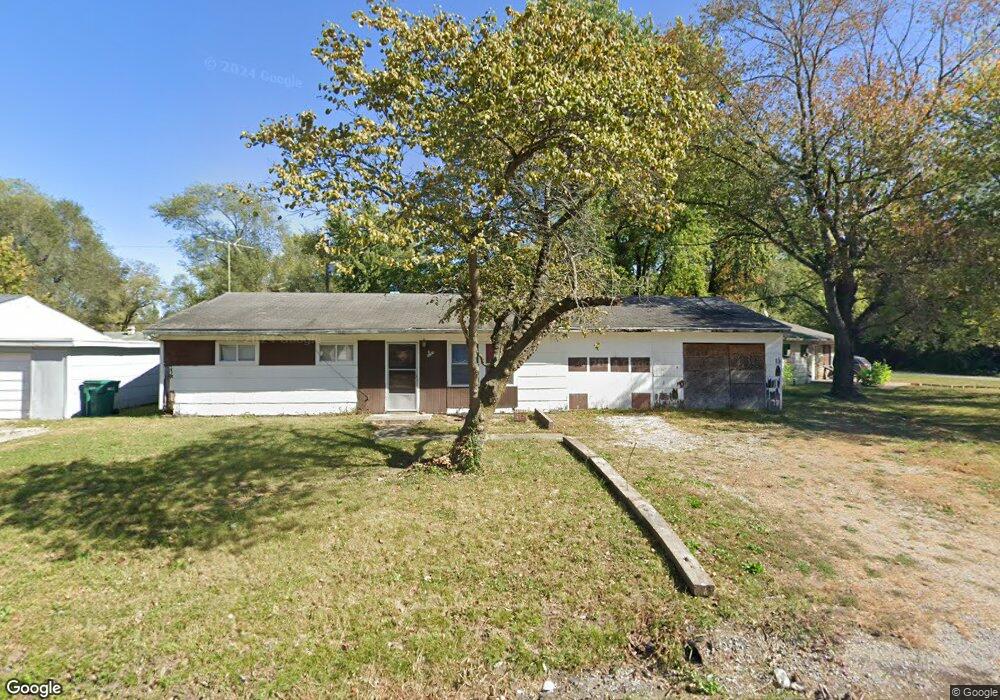
6 Carrel Ct East Saint Louis, IL 62206
Estimated Value: $44,000 - $97,000
--
Bed
--
Bath
925
Sq Ft
$63/Sq Ft
Est. Value
About This Home
This home is located at 6 Carrel Ct, East Saint Louis, IL 62206 and is currently estimated at $58,156, approximately $62 per square foot. 6 Carrel Ct is a home located in St. Clair County.
Ownership History
Date
Name
Owned For
Owner Type
Purchase Details
Closed on
May 15, 2023
Sold by
St Clair County
Bought by
England Garon
Current Estimated Value
Purchase Details
Closed on
Sep 26, 2022
Sold by
St Clair County Clerk
Bought by
St Clair County
Purchase Details
Closed on
Jul 25, 2018
Sold by
Holbrook Thomas
Bought by
Saint Clair County
Purchase Details
Closed on
Apr 26, 2013
Sold by
County Of Saint Clair
Bought by
England Garon
Purchase Details
Closed on
Dec 19, 2012
Sold by
Deutsche Bank National Trust Co
Bought by
Saint Clair County
Purchase Details
Closed on
Nov 26, 2002
Sold by
Fulghum Deloris and Fulghum John
Bought by
Fulghum Deloris
Create a Home Valuation Report for This Property
The Home Valuation Report is an in-depth analysis detailing your home's value as well as a comparison with similar homes in the area
Home Values in the Area
Average Home Value in this Area
Purchase History
| Date | Buyer | Sale Price | Title Company |
|---|---|---|---|
| England Garon | -- | None Available | |
| St Clair County | -- | None Available | |
| Saint Clair County | -- | Attorney | |
| England Garon | -- | None Available | |
| Saint Clair County | -- | None Available | |
| Fulghum Deloris | -- | -- |
Source: Public Records
Tax History Compared to Growth
Tax History
| Year | Tax Paid | Tax Assessment Tax Assessment Total Assessment is a certain percentage of the fair market value that is determined by local assessors to be the total taxable value of land and additions on the property. | Land | Improvement |
|---|---|---|---|---|
| 2024 | $994 | $6,663 | $462 | $6,201 |
| 2023 | $892 | $6,023 | $418 | $5,605 |
| 2022 | $776 | $106 | $53 | $53 |
| 2021 | $794 | $5,002 | $347 | $4,655 |
| 2020 | $776 | $4,664 | $364 | $4,300 |
| 2019 | $805 | $4,664 | $364 | $4,300 |
| 2018 | $814 | $4,732 | $369 | $4,363 |
| 2017 | $852 | $4,618 | $360 | $4,258 |
| 2016 | $929 | $4,971 | $359 | $4,612 |
| 2014 | $759 | $4,917 | $355 | $4,562 |
| 2013 | $693 | $100 | $50 | $50 |
Source: Public Records
Map
Nearby Homes