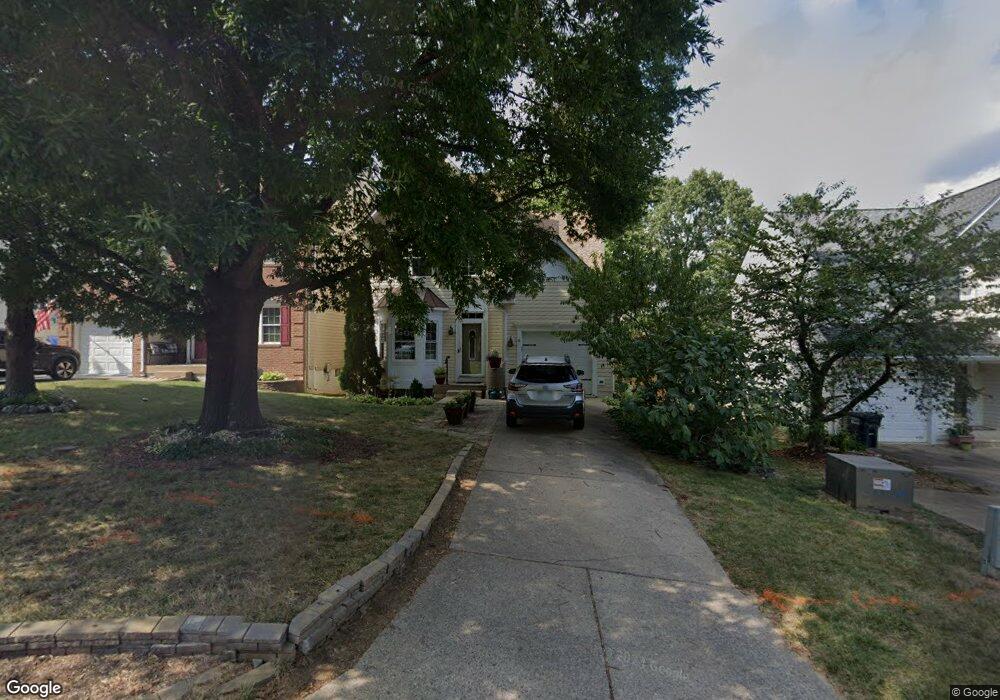
6 Catherine Ln Stafford, VA 22554
Embrey Mill NeighborhoodEstimated Value: $538,000 - $541,818
5
Beds
4
Baths
2,858
Sq Ft
$189/Sq Ft
Est. Value
About This Home
This home is located at 6 Catherine Ln, Stafford, VA 22554 and is currently estimated at $539,955, approximately $188 per square foot. 6 Catherine Ln is a home located in Stafford County with nearby schools including Garrisonville Elementary School, Rodney E. Thompson Middle School, and North Stafford High School.
Ownership History
Date
Name
Owned For
Owner Type
Purchase Details
Closed on
Mar 24, 2008
Sold by
Ehtesham Michael
Bought by
Hillman Christopher
Current Estimated Value
Home Financials for this Owner
Home Financials are based on the most recent Mortgage that was taken out on this home.
Original Mortgage
$307,200
Outstanding Balance
$191,586
Interest Rate
5.76%
Mortgage Type
VA
Estimated Equity
$348,369
Purchase Details
Closed on
Jul 3, 2003
Sold by
Hobson Terri
Bought by
Ehtesham Michael
Home Financials for this Owner
Home Financials are based on the most recent Mortgage that was taken out on this home.
Original Mortgage
$207,900
Interest Rate
5.46%
Mortgage Type
New Conventional
Purchase Details
Closed on
Sep 23, 1999
Sold by
Secty Of Veterans Affairs
Bought by
Hobson Terri F
Home Financials for this Owner
Home Financials are based on the most recent Mortgage that was taken out on this home.
Original Mortgage
$156,000
Interest Rate
8.1%
Create a Home Valuation Report for This Property
The Home Valuation Report is an in-depth analysis detailing your home's value as well as a comparison with similar homes in the area
Home Values in the Area
Average Home Value in this Area
Purchase History
| Date | Buyer | Sale Price | Title Company |
|---|---|---|---|
| Hillman Christopher | $300,000 | -- | |
| Ehtesham Michael | $259,900 | -- | |
| Hobson Terri F | $156,000 | -- |
Source: Public Records
Mortgage History
| Date | Status | Borrower | Loan Amount |
|---|---|---|---|
| Open | Hillman Christopher | $307,200 | |
| Previous Owner | Ehtesham Michael | $207,900 | |
| Previous Owner | Hobson Terri F | $156,000 |
Source: Public Records
Tax History Compared to Growth
Tax History
| Year | Tax Paid | Tax Assessment Tax Assessment Total Assessment is a certain percentage of the fair market value that is determined by local assessors to be the total taxable value of land and additions on the property. | Land | Improvement |
|---|---|---|---|---|
| 2025 | $3,895 | $429,600 | $135,000 | $294,600 |
| 2024 | $3,895 | $429,600 | $135,000 | $294,600 |
| 2023 | $3,567 | $377,500 | $110,000 | $267,500 |
| 2022 | $3,209 | $377,500 | $110,000 | $267,500 |
| 2021 | $2,966 | $305,800 | $85,000 | $220,800 |
| 2020 | $2,966 | $305,800 | $85,000 | $220,800 |
| 2019 | $2,979 | $294,900 | $85,000 | $209,900 |
| 2018 | $2,920 | $294,900 | $85,000 | $209,900 |
| 2017 | $2,756 | $278,400 | $75,000 | $203,400 |
| 2016 | $2,756 | $278,400 | $75,000 | $203,400 |
| 2015 | $2,455 | $270,100 | $75,000 | $195,100 |
| 2014 | $2,455 | $270,100 | $75,000 | $195,100 |
Source: Public Records
Map
Nearby Homes
- 4 Candleridge Ct
- 101 Waters Landing
- 1 Stoneridge Ct
- 1 Ashbrook Rd
- 15 Stoneridge Ct
- 17 Stoneridge Ct
- 12 Heatherbrook Ln
- 1 Jonquil Place
- 412 W Park Dr
- 9 Varone Dr
- 8 Fulton Dr
- 311 W Park Dr
- 1 Idylwood Place
- 409 Waters Cove Ct
- 13 Joplin Ct
- 29 Sassafras Ln
- 23 Fireberry Blvd
- 114 Elmsley Ln
- 10 Sarasota Dr
- 24 Nugent Dr