6 Dalton Rd Dalton, NH 03598
Estimated Value: $447,000 - $634,000
4
Beds
5
Baths
3,309
Sq Ft
$157/Sq Ft
Est. Value
About This Home
This home is located at 6 Dalton Rd, Dalton, NH 03598 and is currently estimated at $520,728, approximately $157 per square foot. 6 Dalton Rd is a home located in Coos County with nearby schools including Whitefield Elementary School and White Mountains Regional High School.
Ownership History
Date
Name
Owned For
Owner Type
Purchase Details
Closed on
Apr 26, 2012
Sold by
Williamson Patrick R and Bank New York Mellon T
Bought by
Bank New York Mellon T
Current Estimated Value
Purchase Details
Closed on
Apr 29, 2004
Sold by
Alba Andre M
Bought by
Williamson Patrick R and Williamson Jacqueline A
Home Financials for this Owner
Home Financials are based on the most recent Mortgage that was taken out on this home.
Original Mortgage
$70,000
Interest Rate
5.36%
Mortgage Type
Purchase Money Mortgage
Purchase Details
Closed on
Oct 2, 2000
Sold by
Lautman David
Bought by
Alba Andre
Home Financials for this Owner
Home Financials are based on the most recent Mortgage that was taken out on this home.
Original Mortgage
$102,000
Interest Rate
7.94%
Create a Home Valuation Report for This Property
The Home Valuation Report is an in-depth analysis detailing your home's value as well as a comparison with similar homes in the area
Home Values in the Area
Average Home Value in this Area
Purchase History
| Date | Buyer | Sale Price | Title Company |
|---|---|---|---|
| Bank New York Mellon T | $225,000 | -- | |
| Williamson Patrick R | $192,100 | -- | |
| Alba Andre | $108,700 | -- |
Source: Public Records
Mortgage History
| Date | Status | Borrower | Loan Amount |
|---|---|---|---|
| Previous Owner | Alba Andre | $70,000 | |
| Previous Owner | Alba Andre | $102,000 |
Source: Public Records
Tax History Compared to Growth
Tax History
| Year | Tax Paid | Tax Assessment Tax Assessment Total Assessment is a certain percentage of the fair market value that is determined by local assessors to be the total taxable value of land and additions on the property. | Land | Improvement |
|---|---|---|---|---|
| 2024 | $6,323 | $419,826 | $40,226 | $379,600 |
| 2023 | $6,192 | $419,826 | $40,226 | $379,600 |
| 2022 | $6,126 | $239,747 | $20,247 | $219,500 |
| 2021 | $6,030 | $239,781 | $20,281 | $219,500 |
| 2020 | $5,786 | $239,777 | $20,277 | $219,500 |
| 2019 | $5,722 | $239,803 | $20,303 | $219,500 |
| 2018 | $5,722 | $239,803 | $20,303 | $219,500 |
| 2017 | $5,092 | $201,519 | $28,519 | $173,000 |
| 2016 | $4,664 | $190,440 | $28,440 | $162,000 |
| 2015 | $4,740 | $190,443 | $28,443 | $162,000 |
| 2014 | $4,286 | $177,345 | $34,345 | $143,000 |
| 2013 | $3,996 | $177,354 | $34,354 | $143,000 |
Source: Public Records
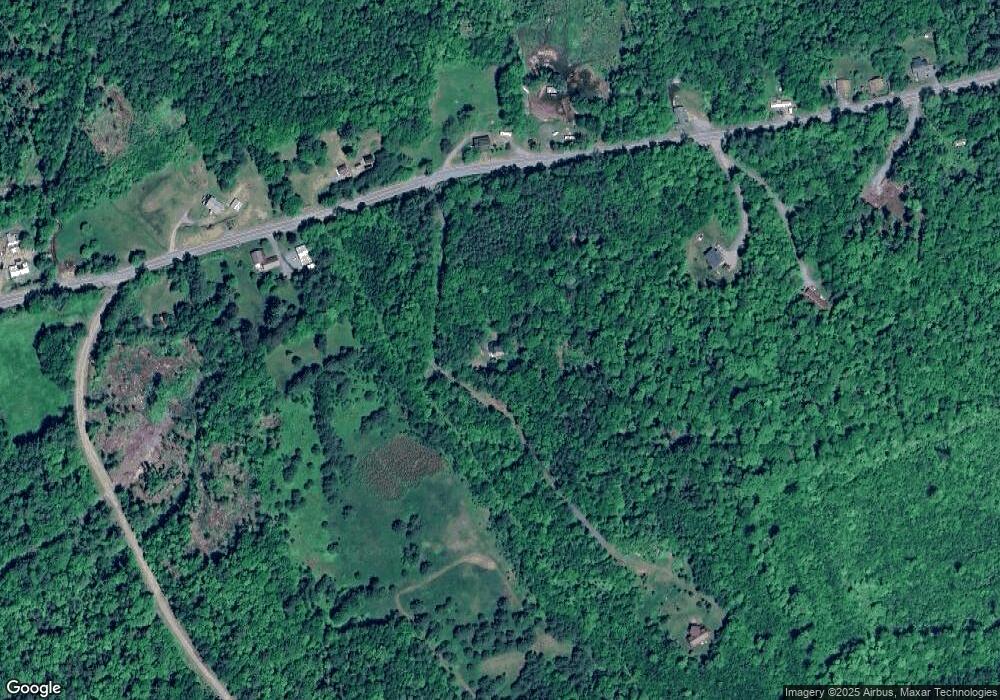
Map
Nearby Homes
- Lot 10 Landry Rd
- 00 Walker Pit Rd
- 0 Walker Pit Rd
- 184 Dalton Rd
- 10 Duval Rd
- 0 Sugar Wood Ln Unit 8
- 0 Thomas Rd Unit 32.1 5052957
- 2157 River Rd
- 000 N Littleton Rd Unit 42
- 231 Simonds Rd
- 640 Baptist Hill Rd
- 0 Oregon Rd
- Lot 4 Oregon Rd
- Lot 90 Faraway Rd
- 00 Oregon Rd
- 34 Perry Rd
- 538 Oregon Rd
- 456 Brickyard Rd
- 0 Evergreen Dr
- 45 Point of View Dr