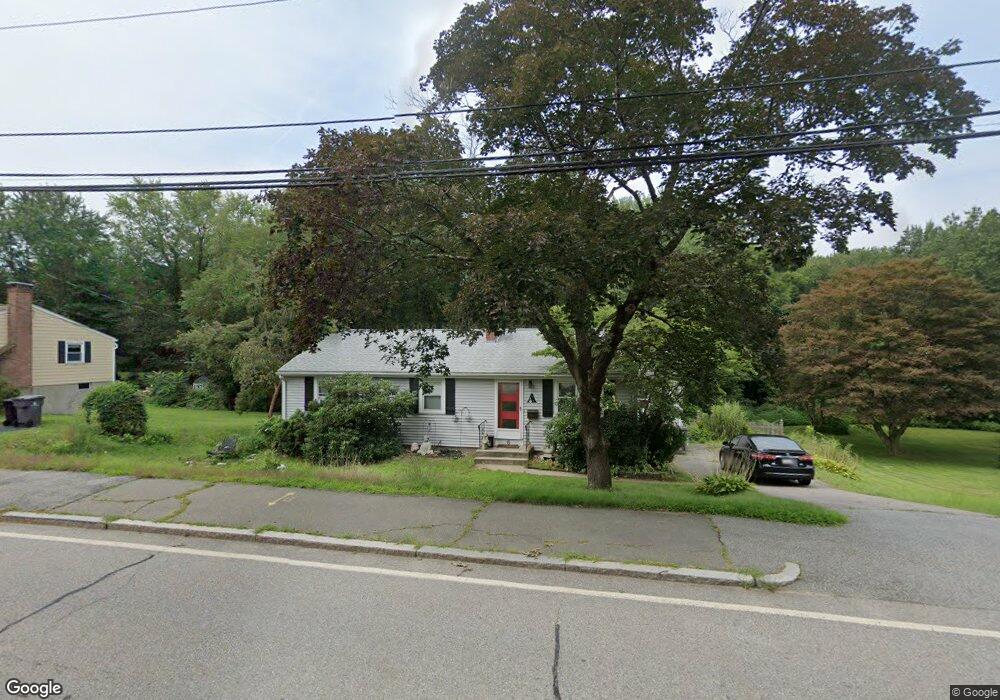
6 Hemenway Rd Framingham, MA 01701
Nobscot NeighborhoodEstimated Value: $640,000 - $692,000
3
Beds
2
Baths
1,324
Sq Ft
$501/Sq Ft
Est. Value
About This Home
This home is located at 6 Hemenway Rd, Framingham, MA 01701 and is currently estimated at $662,705, approximately $500 per square foot. 6 Hemenway Rd is a home located in Middlesex County with nearby schools including Framingham High School, MetroWest Jewish Day School, and Sudbury Valley School.
Ownership History
Date
Name
Owned For
Owner Type
Purchase Details
Closed on
May 28, 2021
Sold by
Ayochok Norman A and Ayochok Signe N
Bought by
Ayochok Norman A
Current Estimated Value
Home Financials for this Owner
Home Financials are based on the most recent Mortgage that was taken out on this home.
Original Mortgage
$87,000
Interest Rate
2.9%
Mortgage Type
New Conventional
Purchase Details
Closed on
May 7, 2020
Sold by
Ayochok Norman A
Bought by
Ayochok Norman A and Ayochok Signe N
Purchase Details
Closed on
Jun 28, 1996
Sold by
Mann Bruce D and Mann Jill A
Bought by
Ayochok Norman A and Ayochok Deborahm
Purchase Details
Closed on
Jul 31, 1992
Sold by
Foran James V and Foran Mary L
Bought by
Mann Bruce D and Mann Jill A
Create a Home Valuation Report for This Property
The Home Valuation Report is an in-depth analysis detailing your home's value as well as a comparison with similar homes in the area
Home Values in the Area
Average Home Value in this Area
Purchase History
| Date | Buyer | Sale Price | Title Company |
|---|---|---|---|
| Ayochok Norman A | -- | None Available | |
| Ayochok Norman A | -- | None Available | |
| Ayochok Norman A | -- | None Available | |
| Ayochok Norman A | -- | None Available | |
| Ayochok Norman A | -- | None Available | |
| Ayochok Norman A | $159,000 | -- | |
| Mann Bruce D | $155,000 | -- | |
| Ayochok Norman A | $159,000 | -- | |
| Mann Bruce D | $155,000 | -- |
Source: Public Records
Mortgage History
| Date | Status | Borrower | Loan Amount |
|---|---|---|---|
| Previous Owner | Ayochok Norman A | $87,000 | |
| Previous Owner | Mann Bruce D | $123,000 |
Source: Public Records
Tax History Compared to Growth
Tax History
| Year | Tax Paid | Tax Assessment Tax Assessment Total Assessment is a certain percentage of the fair market value that is determined by local assessors to be the total taxable value of land and additions on the property. | Land | Improvement |
|---|---|---|---|---|
| 2025 | $6,758 | $566,000 | $278,100 | $287,900 |
| 2024 | $6,457 | $518,200 | $248,300 | $269,900 |
| 2023 | $6,120 | $467,500 | $221,700 | $245,800 |
| 2022 | $5,791 | $421,500 | $201,100 | $220,400 |
| 2021 | $5,637 | $401,200 | $193,300 | $207,900 |
| 2020 | $5,656 | $377,600 | $175,700 | $201,900 |
| 2019 | $5,494 | $357,200 | $175,700 | $181,500 |
| 2018 | $5,417 | $331,900 | $169,100 | $162,800 |
| 2017 | $5,299 | $317,100 | $164,200 | $152,900 |
| 2016 | $5,190 | $298,600 | $164,200 | $134,400 |
| 2015 | $5,150 | $289,000 | $164,100 | $124,900 |
Source: Public Records
Map
Nearby Homes