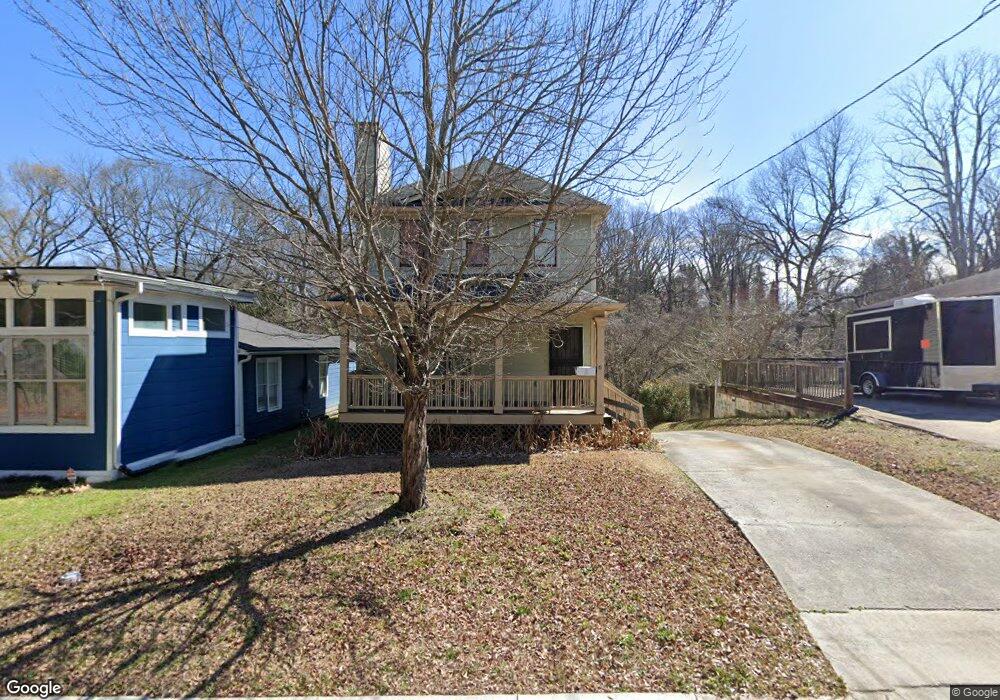
6 Johnson Rd NW Unit 2 Atlanta, GA 30318
Grove Park NeighborhoodEstimated Value: $268,000 - $321,000
4
Beds
2
Baths
1,364
Sq Ft
$217/Sq Ft
Est. Value
About This Home
This home is located at 6 Johnson Rd NW Unit 2, Atlanta, GA 30318 and is currently estimated at $295,865, approximately $216 per square foot. 6 Johnson Rd NW Unit 2 is a home located in Fulton County with nearby schools including Frederick Douglass High School, KIPP Atlanta Collegiate, and Bright Futures Academy.
Ownership History
Date
Name
Owned For
Owner Type
Purchase Details
Closed on
Aug 28, 2018
Sold by
Deed Co Llc
Bought by
Velpry Francois
Current Estimated Value
Purchase Details
Closed on
Sep 5, 2017
Sold by
Velpry Francois
Bought by
Deed Co Llc
Purchase Details
Closed on
Nov 17, 2011
Sold by
1619 Lenox Avenue Llc
Bought by
Velpry Francois
Purchase Details
Closed on
Jul 31, 2009
Sold by
Morgan Stanley Trust 2005 & 3
Bought by
1619 Lenox Avenue Llc
Purchase Details
Closed on
Feb 5, 2008
Sold by
Hampton Rosetta
Bought by
Morgan Stanley Trust 2005 & 3
Purchase Details
Closed on
May 27, 2004
Sold by
Hills Thomas J
Bought by
Katima Inc
Home Financials for this Owner
Home Financials are based on the most recent Mortgage that was taken out on this home.
Original Mortgage
$20,917
Interest Rate
5.88%
Mortgage Type
New Conventional
Create a Home Valuation Report for This Property
The Home Valuation Report is an in-depth analysis detailing your home's value as well as a comparison with similar homes in the area
Home Values in the Area
Average Home Value in this Area
Purchase History
| Date | Buyer | Sale Price | Title Company |
|---|---|---|---|
| Velpry Francois | $44,400 | -- | |
| Deed Co Llc | $37,000 | -- | |
| Velpry Francois | $26,000 | -- | |
| 1619 Lenox Avenue Llc | $30,000 | -- | |
| Morgan Stanley Trust 2005 & 3 | $112,010 | -- | |
| Katima Inc | $20,000 | -- |
Source: Public Records
Mortgage History
| Date | Status | Borrower | Loan Amount |
|---|---|---|---|
| Previous Owner | Katima Inc | $20,917 |
Source: Public Records
Tax History Compared to Growth
Tax History
| Year | Tax Paid | Tax Assessment Tax Assessment Total Assessment is a certain percentage of the fair market value that is determined by local assessors to be the total taxable value of land and additions on the property. | Land | Improvement |
|---|---|---|---|---|
| 2025 | $3,290 | $117,600 | $31,040 | $86,560 |
| 2023 | $4,309 | $104,080 | $48,320 | $55,760 |
| 2022 | $4,212 | $104,080 | $48,320 | $55,760 |
| 2021 | $4,231 | $104,440 | $50,840 | $53,600 |
| 2020 | $737 | $18,000 | $4,120 | $13,880 |
| 2019 | $483 | $18,000 | $4,120 | $13,880 |
| 2018 | $924 | $18,000 | $4,120 | $13,880 |
| 2017 | $689 | $15,960 | $3,760 | $12,200 |
| 2016 | $691 | $15,960 | $3,760 | $12,200 |
| 2015 | $1,154 | $15,960 | $3,760 | $12,200 |
| 2014 | $691 | $15,240 | $7,240 | $8,000 |
Source: Public Records
Map
Nearby Homes
- 0 Cato St NW Unit 7588989
- 15 Johnson Rd NW
- 25 Johnson Rd NW
- 888 Hollywood Rd NW
- 38 Mildred NW
- 30 Johnson Rd NW
- 37 Johnson Rd NW
- 923 N Eugenia Place NW
- 965 Cato St NW
- 836 Wood St NW
- 75 Johnson Rd NW
- 1050 Cato St NW
- 2015 Lois Place NW
- 1039 Margaret Place NW
- 856 Margaret Place NW
- 1075 Cato St NW
- 1974 Lois Place NW
- 2005 Lois Place NW
- 6 Johnson Rd NW
- 8 Johnson Rd NW
- 10 Johnson Rd NW
- 12 Johnson Rd NW
- 12 Johnson Rd NW Unit B
- 0 Cato St NW
- 0 Cato St NW Unit 7534452
- 0 Cato St NW Unit 7344277
- 0 Cato St NW Unit 7255735
- 0 Cato St NW Unit 7242449
- 0 Cato St NW Unit 20132944
- 0 Cato St NW Unit 7208418
- 0 Cato St NW Unit 10107003
- 0 Cato St NW Unit 7131775
- 0 Cato St NW Unit 10098362
- 0 Cato St NW Unit 7124871
- 0 Cato St NW Unit 7122505
- 0 Cato St NW Unit 7290803
- 0 Cato St NW Unit 8290517
- 0 Cato St NW Unit 7028940