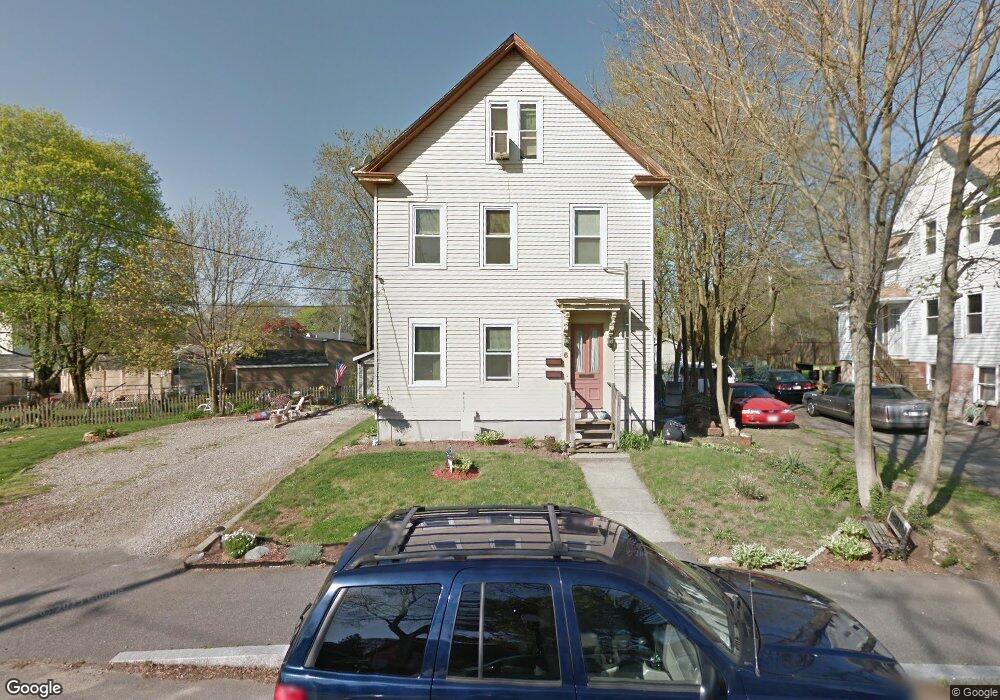
6 Maxwell St Taunton, MA 02780
Whittenton Junction NeighborhoodEstimated Value: $409,000 - $531,000
4
Beds
2
Baths
1,690
Sq Ft
$277/Sq Ft
Est. Value
About This Home
This home is located at 6 Maxwell St, Taunton, MA 02780 and is currently estimated at $468,374, approximately $277 per square foot. 6 Maxwell St is a home located in Bristol County with nearby schools including H. H. Galligan School, Benjamin Friedman Middle School, and Taunton High School.
Ownership History
Date
Name
Owned For
Owner Type
Purchase Details
Closed on
Nov 8, 2000
Sold by
Brown Philip A
Bought by
Borus Craig J and Borus Rachel W
Current Estimated Value
Home Financials for this Owner
Home Financials are based on the most recent Mortgage that was taken out on this home.
Original Mortgage
$159,663
Interest Rate
7.81%
Mortgage Type
Purchase Money Mortgage
Create a Home Valuation Report for This Property
The Home Valuation Report is an in-depth analysis detailing your home's value as well as a comparison with similar homes in the area
Home Values in the Area
Average Home Value in this Area
Purchase History
| Date | Buyer | Sale Price | Title Company |
|---|---|---|---|
| Borus Craig J | $161,000 | -- |
Source: Public Records
Mortgage History
| Date | Status | Borrower | Loan Amount |
|---|---|---|---|
| Open | Borus Craig J | $161,954 | |
| Closed | Borus Craig J | $159,663 | |
| Previous Owner | Borus Craig J | $126,000 | |
| Previous Owner | Borus Craig J | $102,000 |
Source: Public Records
Tax History Compared to Growth
Tax History
| Year | Tax Paid | Tax Assessment Tax Assessment Total Assessment is a certain percentage of the fair market value that is determined by local assessors to be the total taxable value of land and additions on the property. | Land | Improvement |
|---|---|---|---|---|
| 2025 | $4,794 | $438,200 | $99,500 | $338,700 |
| 2024 | $4,333 | $387,200 | $99,500 | $287,700 |
| 2023 | $4,061 | $337,000 | $99,500 | $237,500 |
| 2022 | $3,664 | $278,000 | $83,000 | $195,000 |
| 2021 | $3,559 | $250,600 | $75,400 | $175,200 |
| 2020 | $3,474 | $233,800 | $75,400 | $158,400 |
| 2019 | $3,182 | $201,900 | $75,400 | $126,500 |
| 2018 | $3,058 | $194,500 | $75,600 | $118,900 |
| 2017 | $2,826 | $179,900 | $71,700 | $108,200 |
| 2016 | $2,717 | $173,300 | $69,600 | $103,700 |
| 2015 | $2,460 | $163,900 | $69,600 | $94,300 |
| 2014 | $2,370 | $162,200 | $67,900 | $94,300 |
Source: Public Records
Map
Nearby Homes
- 99 Tremont St
- 108 Tremont St
- 13 Stanley Ave
- 51 Shores St
- 6 Clark Ave
- 137 Tremont St
- 0 Eldridge St Unit 73454842
- 16 Kilton St
- 20 Grand Ave
- 71 Eldridge St
- 26 Kilmer Ave
- 110 Eldridge St Unit B
- 48 Oak St
- 63 Kilmer Ave
- 79 Fremont St
- 96 Danforth St Unit 49
- 193 Tremont St Unit 124
- 193 Tremont St Unit 115
- 54 Adams St
- 55 Highland Ave
- 8 Maxwell St
- 8 Maxwell St
- 8 Maxwell St Unit 2
- 8 Maxwell St Unit 1
- 6 Danforth St
- 10 Maxwell St
- 95 Tremont St
- 95 Tremont St
- 10 Danforth St
- 7 Maxwell St
- 9 Maxwell St
- 12 Danforth St
- 93 Tremont St
- 93 Tremont St Unit 2
- 93 Tremont St Unit 1
- 93 Tremont St Unit 3
- 12 Maxwell St
- 12 Maxwell St Unit 1st flr
- 14 Danforth St
- 97 Tremont St