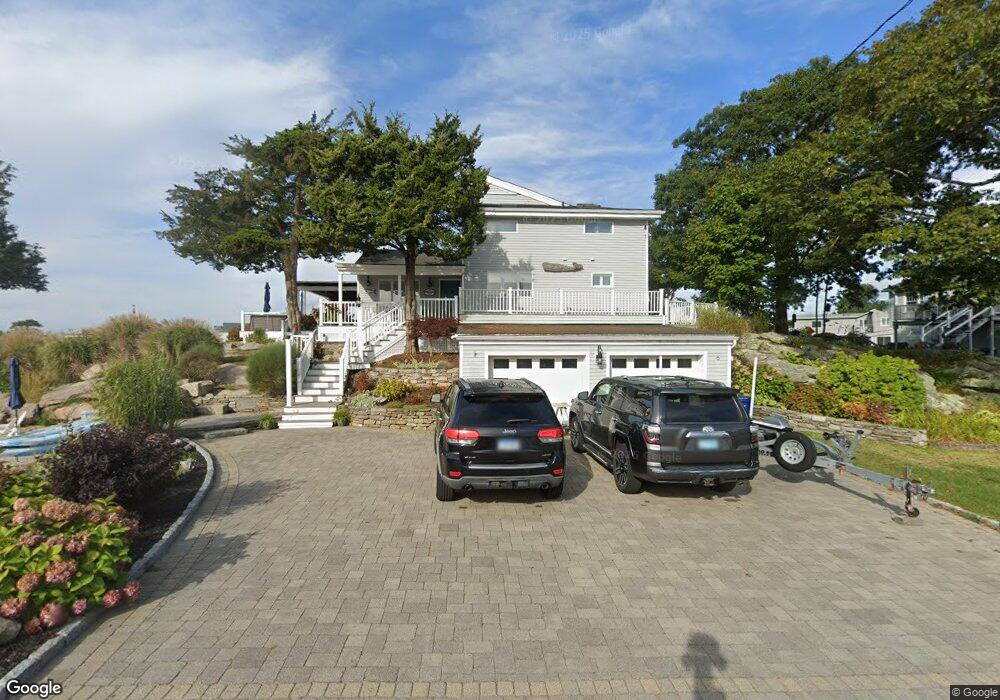
6 Open Way Stonington, CT 06378
Estimated Value: $1,293,000 - $2,017,000
3
Beds
2
Baths
2,355
Sq Ft
$683/Sq Ft
Est. Value
About This Home
This home is located at 6 Open Way, Stonington, CT 06378 and is currently estimated at $1,608,197, approximately $682 per square foot. 6 Open Way is a home located in New London County with nearby schools including Stonington Middle School, Stonington High School, and Pine Point School.
Ownership History
Date
Name
Owned For
Owner Type
Purchase Details
Closed on
Jun 5, 2006
Sold by
Aills Gail Q
Bought by
Orr 3Rd Samuel J
Current Estimated Value
Purchase Details
Closed on
Jan 15, 1998
Sold by
Thresher Lois R
Bought by
Orr Samuel J and Smith Patricia Orr
Create a Home Valuation Report for This Property
The Home Valuation Report is an in-depth analysis detailing your home's value as well as a comparison with similar homes in the area
Home Values in the Area
Average Home Value in this Area
Purchase History
| Date | Buyer | Sale Price | Title Company |
|---|---|---|---|
| Orr 3Rd Samuel J | $150,000 | -- | |
| Orr 3Rd Samuel J | $150,000 | -- | |
| Orr 3Rd Samuel J | $150,000 | -- | |
| Orr 3Rd Samuel J | $150,000 | -- | |
| Orr Samuel J | $600,000 | -- | |
| Orr Samuel J | $600,000 | -- |
Source: Public Records
Mortgage History
| Date | Status | Borrower | Loan Amount |
|---|---|---|---|
| Open | Orr Samuel J | $70,000 |
Source: Public Records
Tax History Compared to Growth
Tax History
| Year | Tax Paid | Tax Assessment Tax Assessment Total Assessment is a certain percentage of the fair market value that is determined by local assessors to be the total taxable value of land and additions on the property. | Land | Improvement |
|---|---|---|---|---|
| 2025 | $20,305 | $1,005,200 | $732,800 | $272,400 |
| 2024 | $19,501 | $1,005,200 | $732,800 | $272,400 |
| 2023 | $19,380 | $1,005,200 | $732,800 | $272,400 |
| 2022 | $19,304 | $736,800 | $565,000 | $171,800 |
| 2021 | $19,393 | $736,800 | $565,000 | $171,800 |
| 2020 | $19,017 | $736,800 | $565,000 | $171,800 |
| 2019 | $19,012 | $736,600 | $565,000 | $171,600 |
| 2018 | $18,404 | $736,600 | $565,000 | $171,600 |
| 2017 | $15,976 | $633,700 | $484,300 | $149,400 |
| 2016 | $15,424 | $633,700 | $484,300 | $149,400 |
| 2015 | $14,797 | $633,700 | $484,300 | $149,400 |
| 2014 | $14,209 | $633,700 | $484,300 | $149,400 |
Source: Public Records
Map
Nearby Homes