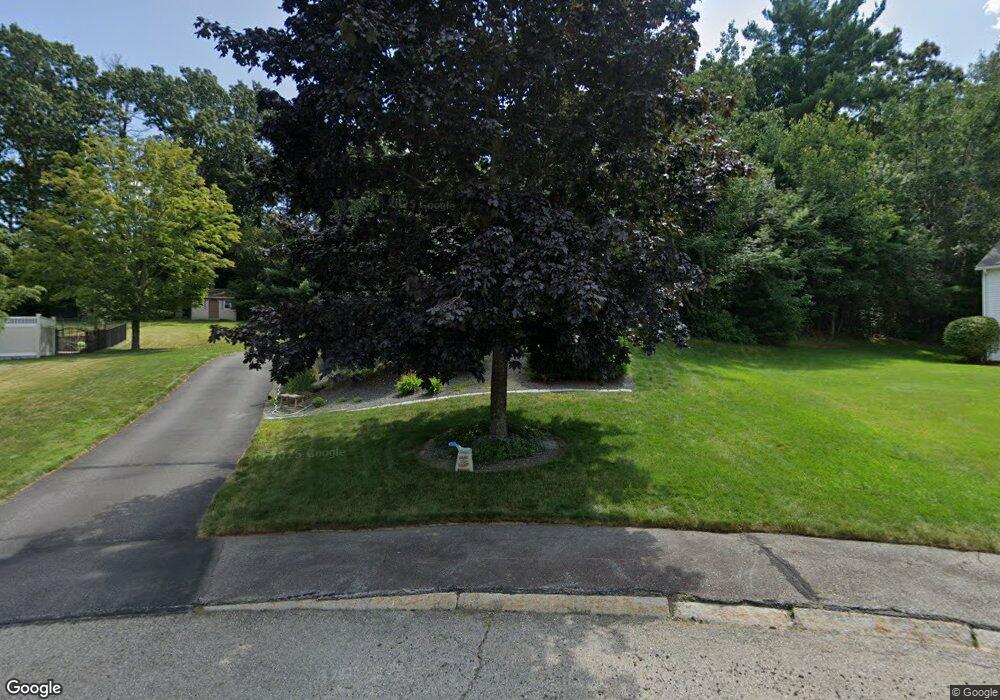
60 Gregoire Dr Marlborough, MA 01752
Estimated Value: $837,000 - $981,000
5
Beds
3
Baths
3,664
Sq Ft
$246/Sq Ft
Est. Value
About This Home
This home is located at 60 Gregoire Dr, Marlborough, MA 01752 and is currently estimated at $901,821, approximately $246 per square foot. 60 Gregoire Dr is a home located in Middlesex County with nearby schools including Marlborough High School, St. Bernadette School, and New Covenant Christian School.
Ownership History
Date
Name
Owned For
Owner Type
Purchase Details
Closed on
Oct 2, 2009
Sold by
Griffin-Ragab Gail P and Vigeant Gail P
Bought by
Hausmann Kevin J and Hausmann Marlene
Current Estimated Value
Home Financials for this Owner
Home Financials are based on the most recent Mortgage that was taken out on this home.
Original Mortgage
$286,000
Outstanding Balance
$187,135
Interest Rate
5.12%
Mortgage Type
Purchase Money Mortgage
Estimated Equity
$714,686
Create a Home Valuation Report for This Property
The Home Valuation Report is an in-depth analysis detailing your home's value as well as a comparison with similar homes in the area
Home Values in the Area
Average Home Value in this Area
Purchase History
| Date | Buyer | Sale Price | Title Company |
|---|---|---|---|
| Hausmann Kevin J | $357,500 | -- |
Source: Public Records
Mortgage History
| Date | Status | Borrower | Loan Amount |
|---|---|---|---|
| Open | Hausmann Kevin J | $286,000 |
Source: Public Records
Tax History Compared to Growth
Tax History
| Year | Tax Paid | Tax Assessment Tax Assessment Total Assessment is a certain percentage of the fair market value that is determined by local assessors to be the total taxable value of land and additions on the property. | Land | Improvement |
|---|---|---|---|---|
| 2025 | $8,002 | $811,600 | $258,000 | $553,600 |
| 2024 | $7,777 | $759,500 | $234,600 | $524,900 |
| 2023 | $7,417 | $642,700 | $196,400 | $446,300 |
| 2022 | $6,944 | $529,300 | $187,000 | $342,300 |
| 2021 | $7,115 | $515,600 | $158,700 | $356,900 |
| 2020 | $6,899 | $486,500 | $145,800 | $340,700 |
| 2019 | $6,730 | $478,300 | $142,900 | $335,400 |
| 2018 | $6,623 | $452,700 | $124,400 | $328,300 |
| 2017 | $6,831 | $445,900 | $121,700 | $324,200 |
| 2016 | $6,940 | $452,400 | $121,700 | $330,700 |
| 2015 | $6,515 | $413,400 | $125,200 | $288,200 |
Source: Public Records
Map
Nearby Homes