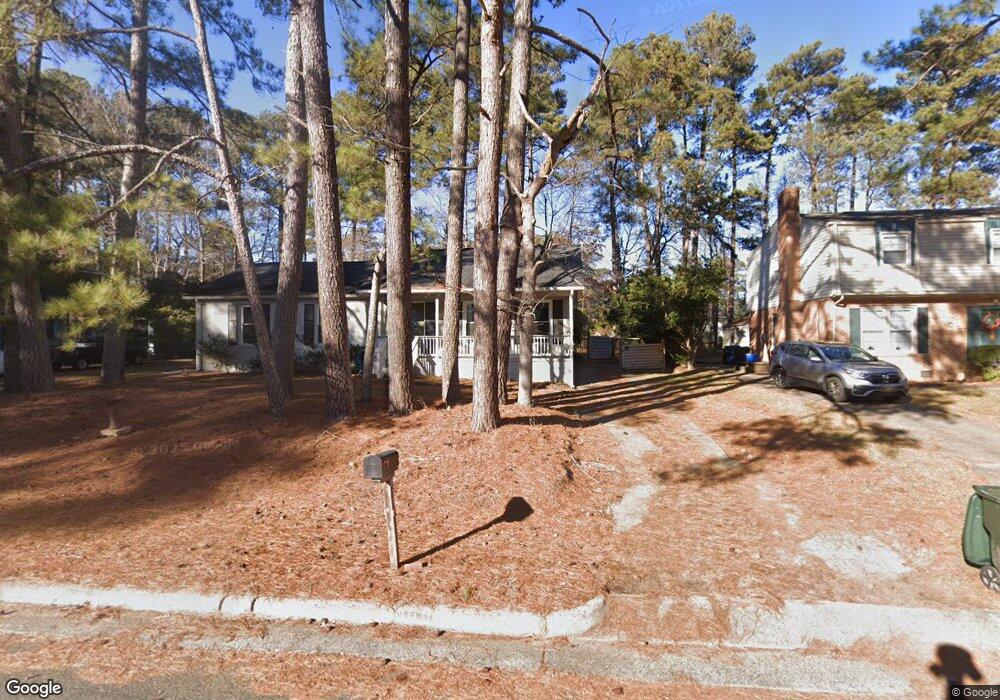
600 Brighton Rd Durham, NC 27707
Hope Valley NeighborhoodEstimated Value: $402,608 - $467,000
3
Beds
2
Baths
1,646
Sq Ft
$262/Sq Ft
Est. Value
About This Home
This home is located at 600 Brighton Rd, Durham, NC 27707 and is currently estimated at $431,402, approximately $262 per square foot. 600 Brighton Rd is a home located in Durham County with nearby schools including Morehead Montessori, Sherwood Githens Middle, and Jordan High School.
Ownership History
Date
Name
Owned For
Owner Type
Purchase Details
Closed on
Oct 31, 2018
Sold by
Prestige Home Solutions Llc
Bought by
Clark Kaytlyn A
Current Estimated Value
Home Financials for this Owner
Home Financials are based on the most recent Mortgage that was taken out on this home.
Original Mortgage
$269,900
Outstanding Balance
$236,347
Interest Rate
4.6%
Mortgage Type
New Conventional
Estimated Equity
$195,055
Purchase Details
Closed on
Jul 13, 2018
Sold by
Scarth Jon Paul and Scarth Susanne Patricia
Bought by
Prestige Home Solutions Llc
Purchase Details
Closed on
May 1, 1998
Sold by
Quansah Juliana A
Bought by
Scarth John Paul and Scarth Susane Patricia
Home Financials for this Owner
Home Financials are based on the most recent Mortgage that was taken out on this home.
Original Mortgage
$128,520
Interest Rate
7.15%
Mortgage Type
VA
Create a Home Valuation Report for This Property
The Home Valuation Report is an in-depth analysis detailing your home's value as well as a comparison with similar homes in the area
Home Values in the Area
Average Home Value in this Area
Purchase History
| Date | Buyer | Sale Price | Title Company |
|---|---|---|---|
| Clark Kaytlyn A | $270,000 | None Available | |
| Prestige Home Solutions Llc | $162,500 | None Available | |
| Scarth John Paul | $126,000 | -- |
Source: Public Records
Mortgage History
| Date | Status | Borrower | Loan Amount |
|---|---|---|---|
| Open | Clark Kaytlyn A | $269,900 | |
| Previous Owner | Scarth John Paul | $128,520 |
Source: Public Records
Tax History Compared to Growth
Tax History
| Year | Tax Paid | Tax Assessment Tax Assessment Total Assessment is a certain percentage of the fair market value that is determined by local assessors to be the total taxable value of land and additions on the property. | Land | Improvement |
|---|---|---|---|---|
| 2025 | $4,169 | $420,582 | $176,400 | $244,182 |
| 2024 | $3,173 | $227,494 | $49,240 | $178,254 |
| 2023 | $2,980 | $227,494 | $49,240 | $178,254 |
| 2022 | $2,912 | $227,494 | $49,240 | $178,254 |
| 2021 | $2,898 | $227,494 | $49,240 | $178,254 |
| 2020 | $2,830 | $227,494 | $49,240 | $178,254 |
| 2019 | $2,830 | $227,494 | $49,240 | $178,254 |
| 2018 | $2,303 | $169,784 | $37,920 | $131,864 |
| 2017 | $2,286 | $169,784 | $37,920 | $131,864 |
| 2016 | $2,209 | $169,784 | $37,920 | $131,864 |
| 2015 | $2,118 | $153,028 | $29,433 | $123,595 |
| 2014 | $2,118 | $153,028 | $29,433 | $123,595 |
Source: Public Records
Map
Nearby Homes
- 305 Reynolds Ave N
- 3535 Hope Valley Rd
- 3600 Trail 23
- 1 Westbury Place
- 1311 Martin Luther King Junior Pkwy
- 160 Grey Elm Trail
- 3623 Hope Valley Rd
- 188 Grey Elm Trail
- 135 Cedar Elm Rd
- 125 Grey Elm Trail
- 127 Cedar Elm Rd
- 3622 Colchester St Unit 7
- 243 Grey Elm Trail
- 2235 Alpine Rd
- 358 Red Elm Dr
- 2221 Alpine Rd
- 2438 Alpine Rd
- 4114 Brenmar Ln
- 10 Hartford Ct
- 3527 Racine St
- 604 Brighton Rd
- 516 Brighton Rd
- 525 Reynolds Ave
- 521 Reynolds Ave
- 514 Brighton Rd
- 608 Brighton Rd
- 527 Reynolds Ave
- 3502 Manford Dr
- 517 Reynolds Ave
- 510 Brighton Rd
- 610 Brighton Rd
- 529 Reynolds Ave
- 513 Reynolds Ave
- 3506 Manford Dr
- 3501 Manford Dr
- 508 Brighton Rd
- 614 Brighton Rd
- 524 Reynolds Ave
- 533 Reynolds Ave
- 520 Reynolds Ave