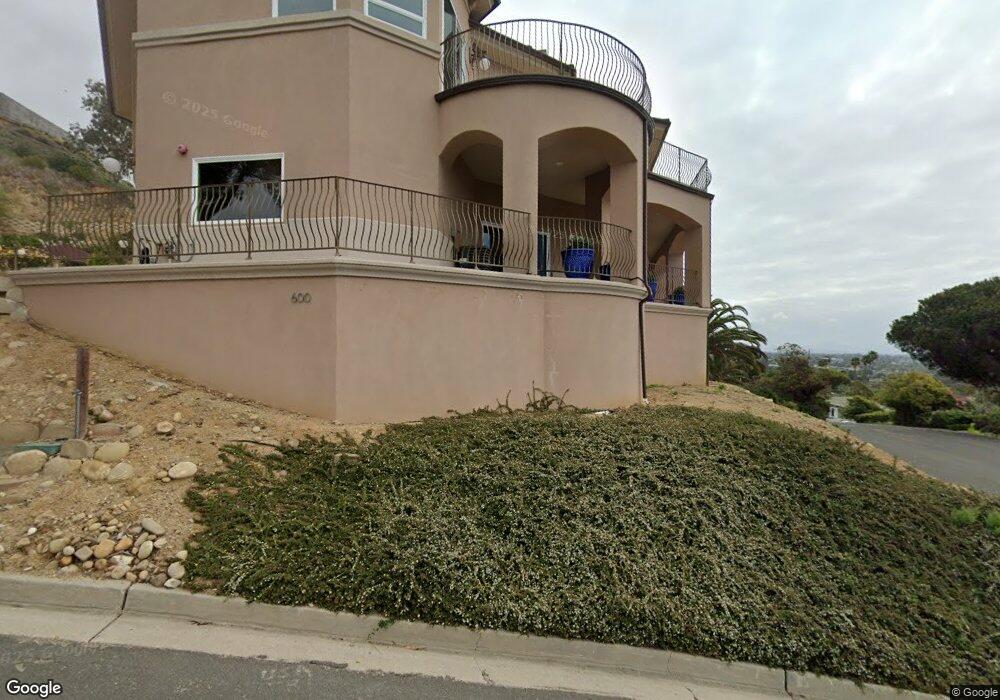
600 Whitecap Dr Ventura, CA 93003
Midtown NeighborhoodEstimated Value: $1,716,000 - $2,490,638
3
Beds
4
Baths
3,251
Sq Ft
$674/Sq Ft
Est. Value
About This Home
This home is located at 600 Whitecap Dr, Ventura, CA 93003 and is currently estimated at $2,192,660, approximately $674 per square foot. 600 Whitecap Dr is a home located in Ventura County with nearby schools including Loma Vista Elementary School, Cabrillo Middle School, and Ventura High School.
Ownership History
Date
Name
Owned For
Owner Type
Purchase Details
Closed on
Nov 3, 2008
Sold by
Walker George Roy and Beck Gail E
Bought by
Walker George Roy and Beck Gail E
Current Estimated Value
Purchase Details
Closed on
Feb 8, 2006
Sold by
Walker George Roy
Bought by
Walker George Roy and Beck Gail E
Home Financials for this Owner
Home Financials are based on the most recent Mortgage that was taken out on this home.
Original Mortgage
$200,000
Outstanding Balance
$112,592
Interest Rate
6.2%
Mortgage Type
Stand Alone Refi Refinance Of Original Loan
Estimated Equity
$2,080,068
Purchase Details
Closed on
Feb 1, 2006
Sold by
Walker George Roy and Beck Gail E
Bought by
Walker George Roy
Home Financials for this Owner
Home Financials are based on the most recent Mortgage that was taken out on this home.
Original Mortgage
$200,000
Outstanding Balance
$112,592
Interest Rate
6.2%
Mortgage Type
Stand Alone Refi Refinance Of Original Loan
Estimated Equity
$2,080,068
Purchase Details
Closed on
Oct 11, 2002
Sold by
Wixen Burton Norman
Bought by
Wixen John Saunders
Purchase Details
Closed on
Mar 15, 2002
Sold by
Wixen Joan Saunders
Bought by
Walker George Roy
Create a Home Valuation Report for This Property
The Home Valuation Report is an in-depth analysis detailing your home's value as well as a comparison with similar homes in the area
Home Values in the Area
Average Home Value in this Area
Purchase History
| Date | Buyer | Sale Price | Title Company |
|---|---|---|---|
| Walker George Roy | -- | None Available | |
| Walker George Roy | -- | None Available | |
| Walker George Roy | -- | None Available | |
| Walker George Roy | -- | None Available | |
| Wixen John Saunders | -- | Old Republic Title Ins Compa | |
| Walker George Roy | $500,000 | Old Republic Title Ins Compa |
Source: Public Records
Mortgage History
| Date | Status | Borrower | Loan Amount |
|---|---|---|---|
| Open | Walker George Roy | $200,000 |
Source: Public Records
Tax History Compared to Growth
Tax History
| Year | Tax Paid | Tax Assessment Tax Assessment Total Assessment is a certain percentage of the fair market value that is determined by local assessors to be the total taxable value of land and additions on the property. | Land | Improvement |
|---|---|---|---|---|
| 2025 | $20,573 | $1,921,279 | $860,818 | $1,060,461 |
| 2024 | $20,573 | $1,883,607 | $843,939 | $1,039,668 |
| 2023 | $20,322 | $1,846,674 | $827,391 | $1,019,283 |
| 2022 | $18,909 | $1,810,465 | $811,167 | $999,298 |
| 2021 | $18,557 | $1,774,966 | $795,262 | $979,704 |
| 2020 | $12,012 | $1,139,700 | $670,500 | $469,200 |
| 2019 | $8,155 | $771,675 | $771,675 | $0 |
| 2018 | $5,970 | $567,408 | $567,408 | $0 |
| 2017 | $17,339 | $1,655,444 | $741,711 | $913,733 |
| 2016 | $16,996 | $1,622,985 | $727,168 | $895,817 |
| 2015 | $16,813 | $1,598,609 | $716,247 | $882,362 |
| 2014 | $16,533 | $1,567,297 | $702,218 | $865,079 |
Source: Public Records
Map
Nearby Homes
- 3124 Grove St
- 251 Palomares Ave
- 505 Briarwood Terrace
- 114 San Marino Ave
- 2407 Sunset Dr
- 2542 Poli St
- 3302 San Luis St
- 3750 Mound Ave
- 4205 Foothill Rd
- 33 Glen Ellen Dr
- 2418 Lexington Dr
- 220 Frances St
- 69 S Seaward Ave
- 325 N Catalina St
- Plan D at Portalvo - Townhomes
- Plan F at Portalvo - Townhomes
- Plan E at Portalvo - Townhomes
- Plan O at Portalvo - Condos/Flats
- Plan A at Portalvo - Townhomes
- Plan H at Portalvo - Condos/Flats
- 628 Whitecap Dr
- 3254 Breaker Dr
- 3265 Island View Dr
- 3200 Island View Dr
- 3224 Island View Dr
- 654 Whitecap Dr
- 3236 Breaker Dr
- 3194 Island View Dr
- 3287 Island View Dr
- 3248 Island View Dr
- 639 Whitecap Dr
- 3172 Island View Dr
- 3218 Breaker Dr
- 0 Island View Dr Unit V0-214030749
- 0 Island View Dr Unit V0-13012962
- 0 Island View Dr
- 3281 Hilltop Dr Unit 6
- 3281 Hilltop Dr
- 3289 Hilltop Dr
- 3169 Island View Dr