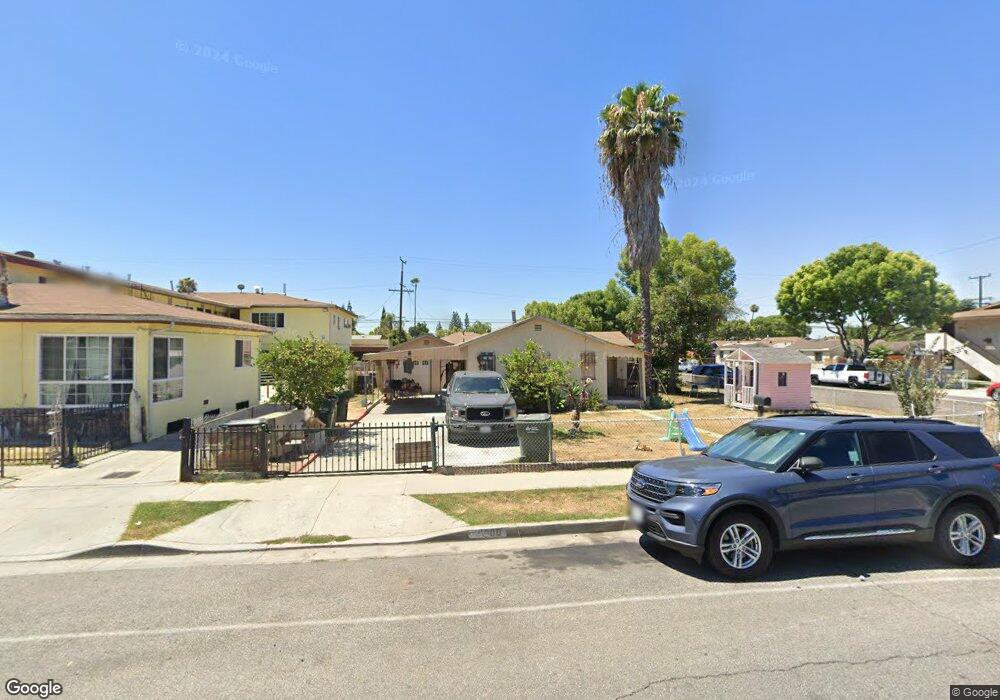
6000 Quinn St Bell Gardens, CA 90201
Estimated Value: $800,000 - $1,110,000
6
Beds
3
Baths
2,136
Sq Ft
$451/Sq Ft
Est. Value
About This Home
This home is located at 6000 Quinn St, Bell Gardens, CA 90201 and is currently estimated at $962,667, approximately $450 per square foot. 6000 Quinn St is a home located in Los Angeles County with nearby schools including Garfield Elementary, Bell Gardens Intermediate School, and Bell Gardens High.
Ownership History
Date
Name
Owned For
Owner Type
Purchase Details
Closed on
Sep 22, 2022
Sold by
Viramontes Ramon and Viramontes Carmen
Bought by
Ramon Viramontes And Carmen Viramontes Revoca and Viramontes
Current Estimated Value
Purchase Details
Closed on
Jun 24, 1997
Sold by
Home Svgs Of America Fsb
Bought by
Viramontes Ramon and Viramontes Carmen
Home Financials for this Owner
Home Financials are based on the most recent Mortgage that was taken out on this home.
Original Mortgage
$149,100
Interest Rate
7.7%
Purchase Details
Closed on
Jan 8, 1997
Sold by
Flores Jose G and Home Svgs Of America Fsb
Bought by
Home Svgs Of America Fsb
Purchase Details
Closed on
Aug 29, 1996
Sold by
Flores Jose Guillermo and Flores Elisa
Bought by
Blue Sky Investments
Create a Home Valuation Report for This Property
The Home Valuation Report is an in-depth analysis detailing your home's value as well as a comparison with similar homes in the area
Home Values in the Area
Average Home Value in this Area
Purchase History
| Date | Buyer | Sale Price | Title Company |
|---|---|---|---|
| Ramon Viramontes And Carmen Viramontes Revoca | -- | None Listed On Document | |
| Viramontes Ramon | $186,500 | Investors Title Company | |
| Home Svgs Of America Fsb | $143,500 | Stewart Title | |
| Blue Sky Investments | $30,977 | -- |
Source: Public Records
Mortgage History
| Date | Status | Borrower | Loan Amount |
|---|---|---|---|
| Previous Owner | Viramontes Ramon | $149,100 |
Source: Public Records
Tax History Compared to Growth
Tax History
| Year | Tax Paid | Tax Assessment Tax Assessment Total Assessment is a certain percentage of the fair market value that is determined by local assessors to be the total taxable value of land and additions on the property. | Land | Improvement |
|---|---|---|---|---|
| 2025 | $6,811 | $375,209 | $167,645 | $207,564 |
| 2024 | $6,811 | $367,853 | $164,358 | $203,495 |
| 2023 | $6,759 | $360,641 | $161,136 | $199,505 |
| 2022 | $6,466 | $353,571 | $157,977 | $195,594 |
| 2021 | $6,083 | $346,639 | $154,880 | $191,759 |
| 2020 | $6,026 | $343,085 | $153,292 | $189,793 |
| 2019 | $5,839 | $336,359 | $150,287 | $186,072 |
| 2018 | $5,736 | $329,765 | $147,341 | $182,424 |
| 2016 | $5,450 | $316,962 | $141,620 | $175,342 |
| 2015 | $5,055 | $312,202 | $139,493 | $172,709 |
| 2014 | $4,908 | $306,087 | $136,761 | $169,326 |
Source: Public Records
Map
Nearby Homes
- 6019 Gotham St
- 6017 Buell St
- 8306 Garfield Ave Unit 8308
- 5659 Quinn St
- 10930 Rio Hondo Dr
- 5526 Clara St
- 6032 Florence Ave
- 7209 Toler Ave
- 5259 Elizabeth St
- 6815 Colmar Ave
- 7214 Perry Rd
- 5231 1/2 Clara St
- 7370 Rio Hondo Place
- 9301 Karmont Ave
- 7215 Emil Ave
- 6524 El Selinda Ave
- 6539 Ajax Ave
- 10702 Old River School Rd
- 5162 E Florence Ave Unit 58
- 11506 Adco Ave
- 8020 Gephart Ave
- 5950 Quinn St
- 6016 Quinn St
- 8011 Gephart Ave
- 8019 Gephart Ave
- 8024 Gephart Ave
- 8023 Gephart Ave
- 6024 Quinn St
- 5942 Quinn St
- 6013 Muller St
- 6015 Muller St
- 6043 Quinn St Unit A
- 8026 Gephart Ave
- 6026 Quinn St
- 6003 Quinn St
- 7931 Gephart Ave
- 6009 Quinn St
- 5955 Muller St
- 6017 Quinn St
- 6030 Quinn St