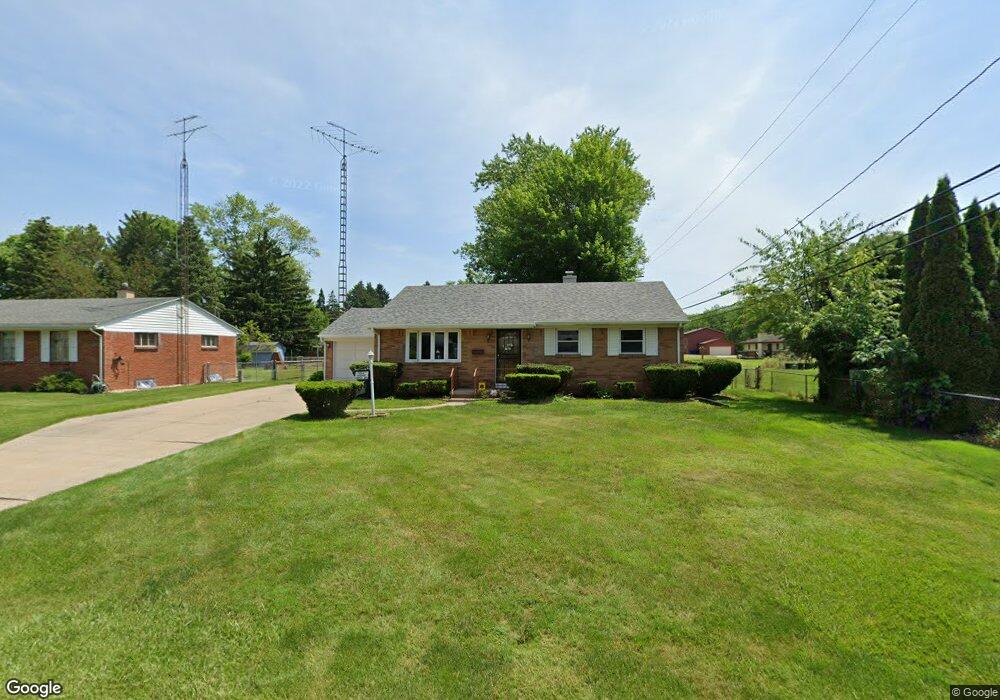
602 Indian Knoll Dr Toledo, OH 43607
Scott Park NeighborhoodEstimated Value: $138,000 - $179,000
3
Beds
1
Bath
1,245
Sq Ft
$124/Sq Ft
Est. Value
About This Home
This home is located at 602 Indian Knoll Dr, Toledo, OH 43607 and is currently estimated at $154,004, approximately $123 per square foot. 602 Indian Knoll Dr is a home located in Lucas County with nearby schools including Keyser Elementary School, Rogers High School, and Victory Academy of Toledo.
Ownership History
Date
Name
Owned For
Owner Type
Purchase Details
Closed on
Jul 1, 2024
Sold by
Smith Brian A and Smith Joy A
Bought by
Smith Brian A and Smith Joy A
Current Estimated Value
Purchase Details
Closed on
Oct 29, 2004
Sold by
Ellis Terri L and Ellis Tyrone
Bought by
Smith Brian A and Smith Joy A
Home Financials for this Owner
Home Financials are based on the most recent Mortgage that was taken out on this home.
Original Mortgage
$112,900
Interest Rate
5.85%
Mortgage Type
Purchase Money Mortgage
Purchase Details
Closed on
Jun 29, 2000
Sold by
Severhof Sally
Bought by
Dotson Terri L
Home Financials for this Owner
Home Financials are based on the most recent Mortgage that was taken out on this home.
Original Mortgage
$77,000
Interest Rate
11.25%
Purchase Details
Closed on
Mar 15, 2000
Sold by
Matuszek Linda
Bought by
Severhof Sally
Purchase Details
Closed on
Mar 1, 2000
Sold by
Estate Of Francis C Swary
Bought by
Matuszek Linda
Purchase Details
Closed on
Apr 15, 1994
Sold by
Greunke Helen B
Create a Home Valuation Report for This Property
The Home Valuation Report is an in-depth analysis detailing your home's value as well as a comparison with similar homes in the area
Home Values in the Area
Average Home Value in this Area
Purchase History
| Date | Buyer | Sale Price | Title Company |
|---|---|---|---|
| Smith Brian A | -- | None Listed On Document | |
| Smith Brian A | $112,900 | Metro Title Agency Inc | |
| Dotson Terri L | $77,000 | First Service Title Agency I | |
| Severhof Sally | $66,900 | -- | |
| Matuszek Linda | -- | -- | |
| -- | -- | -- |
Source: Public Records
Mortgage History
| Date | Status | Borrower | Loan Amount |
|---|---|---|---|
| Previous Owner | Smith Brian A | $112,900 | |
| Previous Owner | Dotson Terri L | $77,000 |
Source: Public Records
Tax History Compared to Growth
Tax History
| Year | Tax Paid | Tax Assessment Tax Assessment Total Assessment is a certain percentage of the fair market value that is determined by local assessors to be the total taxable value of land and additions on the property. | Land | Improvement |
|---|---|---|---|---|
| 2024 | $1,113 | $34,300 | $13,405 | $20,895 |
| 2023 | $1,885 | $27,440 | $9,800 | $17,640 |
| 2022 | $1,875 | $27,440 | $9,800 | $17,640 |
| 2021 | $1,908 | $27,440 | $9,800 | $17,640 |
| 2020 | $1,808 | $22,505 | $7,980 | $14,525 |
| 2019 | $1,761 | $22,505 | $7,980 | $14,525 |
| 2018 | $1,762 | $22,505 | $7,980 | $14,525 |
| 2017 | $1,800 | $22,015 | $7,805 | $14,210 |
| 2016 | $1,809 | $62,900 | $22,300 | $40,600 |
| 2015 | $1,796 | $62,900 | $22,300 | $40,600 |
| 2014 | $1,385 | $22,020 | $7,810 | $14,210 |
| 2013 | $1,385 | $22,020 | $7,810 | $14,210 |
Source: Public Records
Map
Nearby Homes
- 710 N Byrne Rd
- 735 Southbriar Rd
- 615 Cuthbert Rd
- 539 Independence Rd
- 802 Cuthbert Rd
- 326 Independence Rd
- 4111 Kingsley Ct
- 820 MacKow Dr
- 4248 Hunters Trail Dr
- 4229 Wickford Point Dr
- 4345 Foxchapel Rd
- 4132 Redondo Ave
- 826 Ranch Dr
- 1117 Broer Ave
- 4415 Cape Ln
- 3614 Edgevale Rd
- 4347 Merry Ln
- 3925 Hillandale Rd
- 2013 Bretton Place
- 3205 Kylemore Rd
- 610 Indian Knoll Dr
- 3632 Turret Green Dr
- 618 Indian Knoll Dr
- 603 Jamestown Dr
- 597 Jamestown Dr
- 611 Jamestown Dr
- 3620 Turret Green Dr
- 597 Indian Knoll Dr
- 603 Indian Knoll Dr
- 619 Jamestown Dr
- 3633 Whitegate Dr
- 3656 Turret Green Dr
- 3654 Turret Green Dr
- 619 Indian Knoll Dr
- 3615 Whitegate Dr
- 3629 Turret Green Dr
- 3637 Turret Green Dr
- 3704 Turret Green Dr
- 3653 Whitegate Dr
- 3643 Turret Green Dr