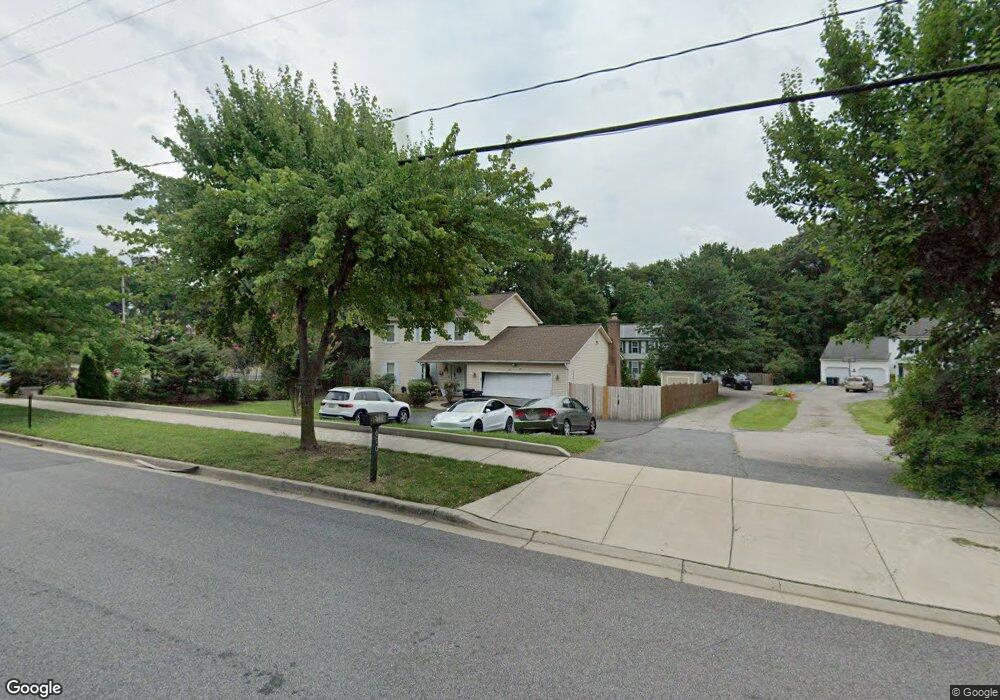
6024 Princess Garden Pkwy Lanham, MD 20706
Estimated Value: $518,000 - $588,000
--
Bed
3
Baths
2,100
Sq Ft
$261/Sq Ft
Est. Value
About This Home
This home is located at 6024 Princess Garden Pkwy, Lanham, MD 20706 and is currently estimated at $547,265, approximately $260 per square foot. 6024 Princess Garden Pkwy is a home located in Prince George's County with nearby schools including Gaywood Elementary School, Thomas Johnson Middle School, and Duval High School.
Ownership History
Date
Name
Owned For
Owner Type
Purchase Details
Closed on
Mar 22, 2023
Sold by
Bhandari Gaurav
Bought by
Bhandari Gaurav and Bhandari Sh
Current Estimated Value
Purchase Details
Closed on
Mar 15, 2021
Sold by
Bhandari Gaurav and Swarn Bhandari Living Trust
Bought by
Bhandari Gaurav
Home Financials for this Owner
Home Financials are based on the most recent Mortgage that was taken out on this home.
Original Mortgage
$300,000
Interest Rate
3%
Mortgage Type
New Conventional
Purchase Details
Closed on
Oct 28, 2016
Sold by
Nbhandari Swarn K and Bhandari Swarn
Bought by
Bhandari Swarn
Purchase Details
Closed on
Jun 22, 2005
Sold by
Ri Bh
Bought by
Bhandari Swarn K
Purchase Details
Closed on
Feb 5, 1991
Sold by
Hayden Barney M
Bought by
Bhandari Swarn K and Bhandari Saroj
Create a Home Valuation Report for This Property
The Home Valuation Report is an in-depth analysis detailing your home's value as well as a comparison with similar homes in the area
Home Values in the Area
Average Home Value in this Area
Purchase History
| Date | Buyer | Sale Price | Title Company |
|---|---|---|---|
| Bhandari Gaurav | -- | Hutton Patt Title | |
| Bhandari Gaurav | -- | Accommodation | |
| Bhandari Swarn | -- | None Available | |
| Bhandari Swarn K | -- | -- | |
| Bhandari Swarn K | $150,000 | -- |
Source: Public Records
Mortgage History
| Date | Status | Borrower | Loan Amount |
|---|---|---|---|
| Previous Owner | Bhandari Gaurav | $300,000 |
Source: Public Records
Tax History Compared to Growth
Tax History
| Year | Tax Paid | Tax Assessment Tax Assessment Total Assessment is a certain percentage of the fair market value that is determined by local assessors to be the total taxable value of land and additions on the property. | Land | Improvement |
|---|---|---|---|---|
| 2025 | $7,143 | $544,067 | -- | -- |
| 2024 | $7,143 | $487,333 | $0 | $0 |
| 2023 | $4,788 | $430,600 | $81,400 | $349,200 |
| 2022 | $6,797 | $430,600 | $81,400 | $349,200 |
| 2021 | $6,797 | $430,600 | $81,400 | $349,200 |
| 2020 | $6,804 | $431,100 | $70,700 | $360,400 |
| 2019 | $6,110 | $426,667 | $0 | $0 |
| 2018 | $6,639 | $422,233 | $0 | $0 |
| 2017 | $5,637 | $417,800 | $0 | $0 |
| 2016 | -- | $352,567 | $0 | $0 |
| 2015 | $4,266 | $287,333 | $0 | $0 |
| 2014 | $4,266 | $222,100 | $0 | $0 |
Source: Public Records
Map
Nearby Homes
- 6000 Princess Garden Pkwy
- 8517 Oglethorpe St
- 5907 85th Place
- 4837 Vista Green Ln
- 6123 Naval Ave
- 6005 84th Ave
- 6318 Princess Garden Pkwy
- 6119 85th Ave
- 8314 Nicholson St
- 9204 Cooks Point Ct Unit 16
- 8811 Priscilla Ct
- 8306 Oglethorpe St
- 6205 85th Place
- 9119 6th St
- 10535 John Glenn St
- 9102 4th St
- 5613 Gregory Dr
- 5518 Lanham Station Rd
- 9018 3rd St
- 8501 Carrollton Pkwy
- 6104 Princess Garden Pkwy
- 6100 Princess Garden Pkwy
- 6102 Princess Garden Pkwy
- 6106 Princess Garden Pkwy
- 6105 Princess Garden Pkwy
- 6017 Princess Garden Pkwy
- 6108 Princess Garden Pkwy
- 6016 Princess Garden Pkwy
- 6103 Princess Garden Pkwy
- 6011 Princess Garden Pkwy
- 6011 Princess Garden Pkwy
- 6013 Princess Garden Pkwy
- 6109 Princess Garden Pkwy
- 6015 Princess Garden Pkwy
- 6111 Princess Garden Pkwy
- 6010 Princess Garden Pkwy
- 6013 Princess Garden Pkwy
- 6110 Princess Garden Pkwy
- 6010 Princess Garden Pkwy
- 6115 Princess Garden Pkwy