Estimated Value: $242,000 - $410,786
3
Beds
1
Bath
1,953
Sq Ft
$172/Sq Ft
Est. Value
About This Home
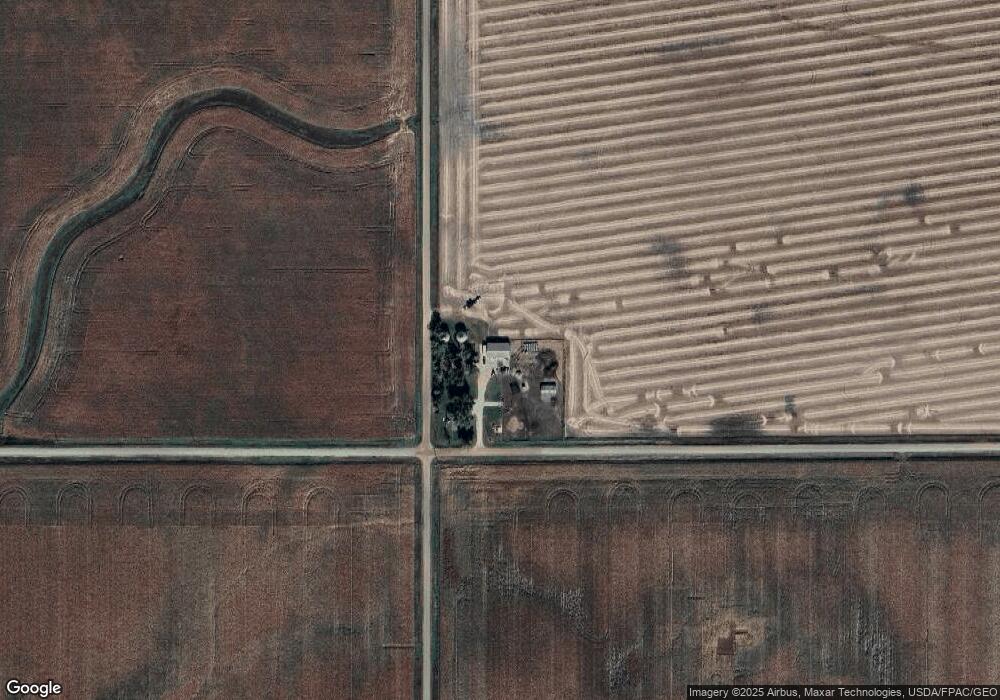
This home is located at 603 260th St, Ogden, IA 50212 and is currently estimated at $335,697, approximately $171 per square foot. 603 260th St is a home located in Boone County with nearby schools including Ogden Elementary School, Ogden Middle School, and Ogden High School.
Ownership History
Date
Name
Owned For
Owner Type
Purchase Details
Closed on
Jun 8, 2018
Sold by
Savits Gregory F and Savits Kathleen S
Bought by
Savits Justin and Stumbo Kelsey
Current Estimated Value
Home Financials for this Owner
Home Financials are based on the most recent Mortgage that was taken out on this home.
Original Mortgage
$196,000
Outstanding Balance
$169,507
Interest Rate
4.5%
Mortgage Type
New Conventional
Estimated Equity
$166,190
Purchase Details
Closed on
May 3, 2017
Sold by
Wells Fargo Bank Na
Bought by
Savits Gregory F and Savits Kathleen S
Purchase Details
Closed on
Dec 28, 2016
Sold by
The Secretary Of Hud
Bought by
Wells Fargo Bank N A
Purchase Details
Closed on
Nov 17, 2005
Sold by
Hasstedt M L and Hasstedt Donna C
Bought by
Neal Toney O and Neal Toni M O
Home Financials for this Owner
Home Financials are based on the most recent Mortgage that was taken out on this home.
Original Mortgage
$133,209
Interest Rate
6.17%
Mortgage Type
FHA
Create a Home Valuation Report for This Property
The Home Valuation Report is an in-depth analysis detailing your home's value as well as a comparison with similar homes in the area
Home Values in the Area
Average Home Value in this Area
Purchase History
| Date | Buyer | Sale Price | Title Company |
|---|---|---|---|
| Savits Justin | -- | -- | |
| Savits Gregory F | $49,000 | None Available | |
| Wells Fargo Bank N A | -- | None Available | |
| Neal Toney O | $135,500 | -- |
Source: Public Records
Mortgage History
| Date | Status | Borrower | Loan Amount |
|---|---|---|---|
| Open | Savits Justin | $196,000 | |
| Previous Owner | Neal Toney O | $133,209 |
Source: Public Records
Tax History Compared to Growth
Tax History
| Year | Tax Paid | Tax Assessment Tax Assessment Total Assessment is a certain percentage of the fair market value that is determined by local assessors to be the total taxable value of land and additions on the property. | Land | Improvement |
|---|---|---|---|---|
| 2025 | $2,842 | $291,150 | $3,890 | $287,260 |
| 2024 | $2,842 | $263,854 | $2,700 | $261,154 |
| 2023 | $2,286 | $263,854 | $2,700 | $261,154 |
| 2022 | $2,249 | $184,287 | $3,949 | $180,338 |
| 2021 | $2,244 | $184,287 | $3,949 | $180,338 |
| 2020 | $2,140 | $168,997 | $3,949 | $165,048 |
| 2019 | $2,002 | $171,668 | $46,000 | $125,668 |
| 2018 | $956 | $69,582 | $0 | $0 |
| 2017 | $956 | $71,750 | $48,000 | $23,750 |
| 2016 | $988 | $71,750 | $48,000 | $23,750 |
| 2015 | $992 | $71,750 | $0 | $0 |
| 2014 | $982 | $71,750 | $0 | $0 |
Source: Public Records
Map
Nearby Homes