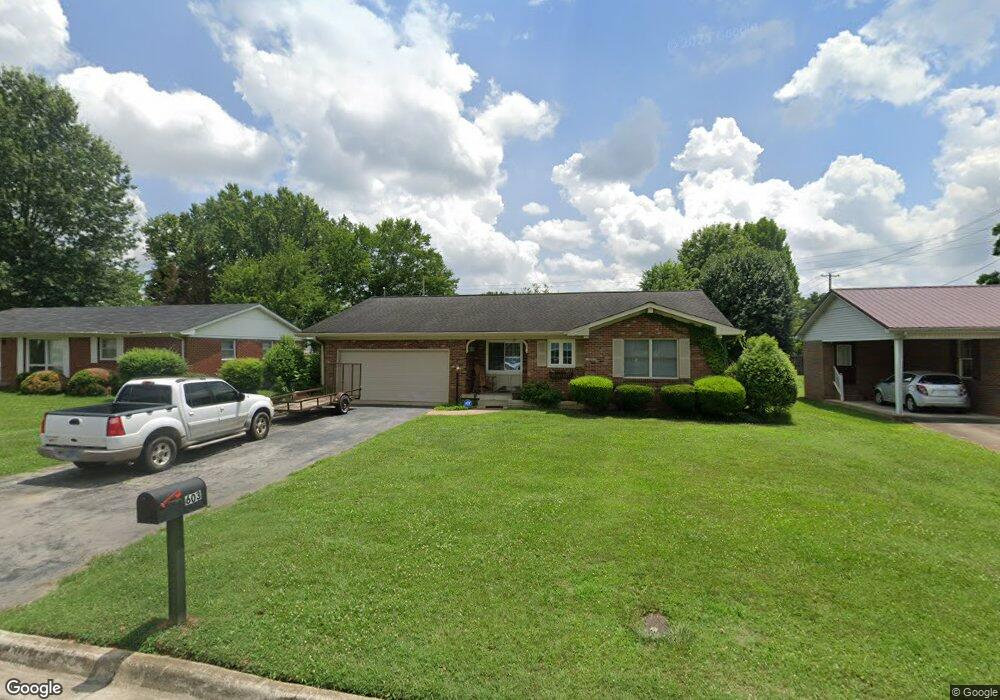
603 2nd St Lawrenceburg, TN 38464
Estimated Value: $197,421 - $257,000
--
Bed
2
Baths
1,543
Sq Ft
$151/Sq Ft
Est. Value
About This Home
This home is located at 603 2nd St, Lawrenceburg, TN 38464 and is currently estimated at $233,605, approximately $151 per square foot. 603 2nd St is a home located in Lawrence County with nearby schools including Ingram Sowell Elementary School, Lawrenceburg Public Elementary School, and David Crockett Elementary School.
Ownership History
Date
Name
Owned For
Owner Type
Purchase Details
Closed on
Oct 25, 2019
Sold by
Wilson Mary Evelyn
Bought by
Smith Tina F
Current Estimated Value
Home Financials for this Owner
Home Financials are based on the most recent Mortgage that was taken out on this home.
Original Mortgage
$149,500
Outstanding Balance
$130,970
Interest Rate
3.5%
Mortgage Type
VA
Estimated Equity
$102,635
Purchase Details
Closed on
Jul 19, 1995
Bought by
Wilson Mary Evelyn
Purchase Details
Closed on
Jan 7, 1972
Bought by
Hyde Marvin and Hyde Hapel
Create a Home Valuation Report for This Property
The Home Valuation Report is an in-depth analysis detailing your home's value as well as a comparison with similar homes in the area
Home Values in the Area
Average Home Value in this Area
Purchase History
| Date | Buyer | Sale Price | Title Company |
|---|---|---|---|
| Smith Tina F | $149,500 | Titleone Twin Falls | |
| Wilson Mary Evelyn | $68,500 | -- | |
| Hyde Marvin | -- | -- |
Source: Public Records
Mortgage History
| Date | Status | Borrower | Loan Amount |
|---|---|---|---|
| Open | Smith Tina F | $149,500 |
Source: Public Records
Tax History Compared to Growth
Tax History
| Year | Tax Paid | Tax Assessment Tax Assessment Total Assessment is a certain percentage of the fair market value that is determined by local assessors to be the total taxable value of land and additions on the property. | Land | Improvement |
|---|---|---|---|---|
| 2025 | $1,299 | $41,775 | $0 | $0 |
| 2024 | $1,299 | $41,775 | $2,000 | $39,775 |
| 2023 | $1,299 | $41,775 | $2,000 | $39,775 |
| 2022 | $1,299 | $41,775 | $2,000 | $39,775 |
| 2021 | $1,197 | $27,225 | $2,000 | $25,225 |
| 2020 | $1,197 | $27,225 | $2,000 | $25,225 |
| 2019 | $988 | $22,475 | $2,000 | $20,475 |
| 2018 | $988 | $22,475 | $2,000 | $20,475 |
| 2017 | $988 | $22,475 | $2,000 | $20,475 |
| 2016 | $988 | $22,475 | $2,000 | $20,475 |
| 2015 | $935 | $22,475 | $2,000 | $20,475 |
| 2014 | $891 | $21,400 | $2,000 | $19,400 |
Source: Public Records
Map
Nearby Homes