
SOLD MAY 31, 2012
RENTED JUL 6, 2025
603 E 5th St Unit 2 Boston, MA 02127
South Boston Neighborhood
1
Bed
1
Bath
663
Sq Ft
871
Sq Ft Lot
Highlights
- Waterfront
- Property is near public transit
- Main Floor Primary Bedroom
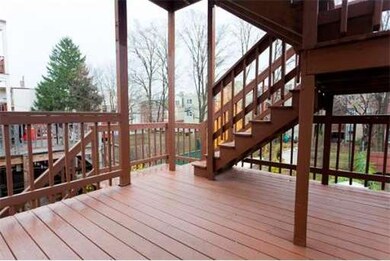
- Deck
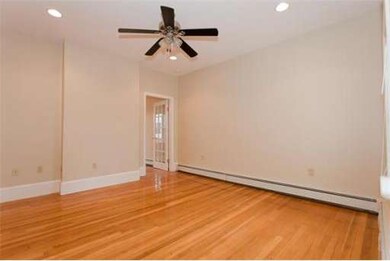
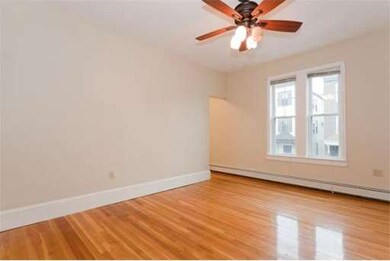
- Wood Flooring
- Walk-In Closet
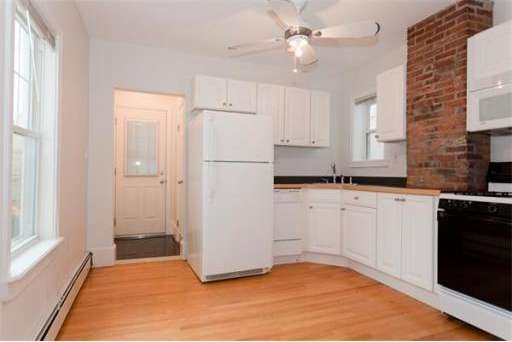
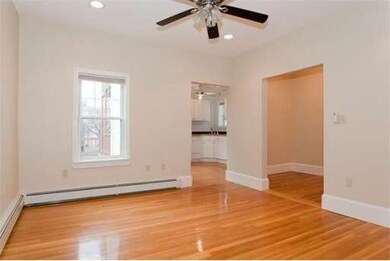
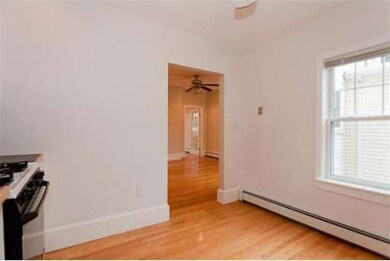
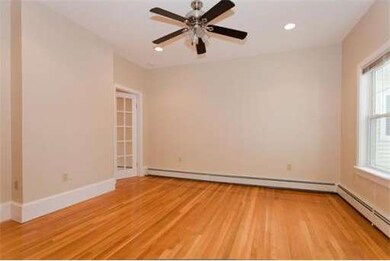
About This Home
As of October 2024Great Value! Perfect one bed in great east side locale. This impeccable home features a generous flowing open floor plan leading to a large private deck. Also offers spacious bedroom with custom walk in closet, full ceramic bath, washer/dryer, remodled kitchen, hardwood thruout, ample private storage. Low condo fee/taxes, 100% owner occupied and more! You MUST SEE to appreciate this home! Simply beautiful!
Property Details
Home Type
- Condominium
Est. Annual Taxes
- $3,680
Year Built
- Built in 1905
Home Design
- Frame Construction
- Rubber Roof
Interior Spaces
- 663 Sq Ft Home
- 1-Story Property
- Ceiling Fan
- Wood Flooring
Kitchen
- Range<<rangeHoodToken>>
- Dishwasher
- Disposal
Bedrooms and Bathrooms
- 1 Primary Bedroom on Main
- Walk-In Closet
- 1 Full Bathroom
Utilities
- No Cooling
- 1 Heating Zone
- Baseboard Heating
- Natural Gas Connected
- Gas Water Heater
- Cable TV Available
Additional Features
- Deck
- Waterfront
- Property is near public transit
Listing and Financial Details
- Assessor Parcel Number W:06 P:02420 S:004,4541850
Community Details
Overview
- Property has a Home Owners Association
- Association fees include water, sewer, insurance
- 3 Units
- Mid-Rise Condominium
Amenities
- Shops
- Laundry Facilities
Recreation
- Park
Ownership History
Date
Name
Owned For
Owner Type
Purchase Details
Listed on
Oct 12, 2017
Closed on
Dec 22, 2017
Sold by
Early Janet K
Bought by
Roberto David
Seller's Agent
Marcella Sliney
Coldwell Banker Realty - Boston
Buyer's Agent
Stacey Pagos
Gibson Sotheby's International Realty
List Price
$499,000
Sold Price
$460,000
Premium/Discount to List
-$39,000
-7.82%
Current Estimated Value
Home Financials for this Owner
Home Financials are based on the most recent Mortgage that was taken out on this home.
Estimated Appreciation
$103,139
Avg. Annual Appreciation
2.70%
Purchase Details
Closed on
Jun 1, 2005
Sold by
Sullivan Lisa J
Bought by
Boyle John P
Home Financials for this Owner
Home Financials are based on the most recent Mortgage that was taken out on this home.
Original Mortgage
$208,000
Interest Rate
5.83%
Mortgage Type
Purchase Money Mortgage
Similar Homes in the area
Create a Home Valuation Report for This Property
The Home Valuation Report is an in-depth analysis detailing your home's value as well as a comparison with similar homes in the area
Home Values in the Area
Average Home Value in this Area
Purchase History
| Date | Type | Sale Price | Title Company |
|---|---|---|---|
| Not Resolvable | $460,000 | -- | |
| Land Court Massachusetts | $260,000 | -- | |
| Land Court Massachusetts | $260,000 | -- |
Source: Public Records
Mortgage History
| Date | Status | Loan Amount | Loan Type |
|---|---|---|---|
| Open | $545,000 | Adjustable Rate Mortgage/ARM | |
| Closed | $424,000 | Stand Alone Refi Refinance Of Original Loan | |
| Closed | $423,500 | Stand Alone Refi Refinance Of Original Loan | |
| Closed | $453,600 | Adjustable Rate Mortgage/ARM | |
| Previous Owner | $208,000 | Purchase Money Mortgage |
Source: Public Records
Property History
| Date | Event | Price | Change | Sq Ft Price |
|---|---|---|---|---|
| 07/06/2025 07/06/25 | Rented | $3,400 | +3.0% | -- |
| 07/01/2025 07/01/25 | For Rent | $3,300 | +10.0% | -- |
| 10/19/2024 10/19/24 | Rented | $3,000 | 0.0% | -- |
| 10/03/2024 10/03/24 | Sold | $545,000 | 0.0% | $822 / Sq Ft |
| 09/26/2024 09/26/24 | For Rent | $3,200 | 0.0% | -- |
| 09/17/2024 09/17/24 | Pending | -- | -- | -- |
| 09/11/2024 09/11/24 | For Sale | $560,000 | 0.0% | $845 / Sq Ft |
| 04/15/2021 04/15/21 | Rented | $2,500 | -3.8% | -- |
| 04/13/2021 04/13/21 | Under Contract | -- | -- | -- |
| 03/16/2021 03/16/21 | For Rent | $2,600 | 0.0% | -- |
| 12/22/2017 12/22/17 | Sold | $460,000 | -4.0% | $694 / Sq Ft |
| 11/15/2017 11/15/17 | Pending | -- | -- | -- |
| 11/01/2017 11/01/17 | Price Changed | $479,000 | -4.0% | $722 / Sq Ft |
| 10/12/2017 10/12/17 | For Sale | $499,000 | +85.2% | $753 / Sq Ft |
| 05/31/2012 05/31/12 | Sold | $269,500 | -7.0% | $406 / Sq Ft |
| 03/31/2012 03/31/12 | Pending | -- | -- | -- |
| 01/10/2012 01/10/12 | For Sale | $289,900 | -- | $437 / Sq Ft |
Source: MLS Property Information Network (MLS PIN)
Tax History Compared to Growth
Tax History
| Year | Tax Paid | Tax Assessment Tax Assessment Total Assessment is a certain percentage of the fair market value that is determined by local assessors to be the total taxable value of land and additions on the property. | Land | Improvement |
|---|---|---|---|---|
| 2025 | $5,576 | $481,500 | $0 | $481,500 |
| 2024 | $5,364 | $492,100 | $0 | $492,100 |
| 2023 | $5,178 | $482,100 | $0 | $482,100 |
| 2022 | $5,043 | $463,500 | $0 | $463,500 |
| 2021 | $4,848 | $454,400 | $0 | $454,400 |
| 2020 | $4,272 | $404,500 | $0 | $404,500 |
| 2019 | $3,986 | $378,200 | $0 | $378,200 |
| 2018 | $4,149 | $395,900 | $0 | $395,900 |
| 2017 | $3,919 | $370,100 | $0 | $370,100 |
| 2016 | $3,840 | $349,100 | $0 | $349,100 |
| 2015 | $4,024 | $332,300 | $0 | $332,300 |
| 2014 | $3,731 | $296,600 | $0 | $296,600 |
Source: Public Records
Agents Affiliated with this Home
-
Leah Snowdale
Seller's Agent in 2025
Leah Snowdale
Compass
(508) 274-6897
2 in this area
82 Total Sales
-
T
Seller's Agent in 2024
The Joanna Schlansky Residential Team
Elite Realty Experts, LLC
-
Kayla Walsh
Seller Co-Listing Agent in 2024
Kayla Walsh
Elite Realty Experts, LLC
(781) 572-5110
1 in this area
11 Total Sales
-
Marcella Sliney
Seller's Agent in 2017
Marcella Sliney
Coldwell Banker Realty - Boston
(617) 835-4323
36 in this area
51 Total Sales
-
S
Buyer's Agent in 2017
Stacey Pagos
Gibson Sothebys International Realty
-
Joseph Clancy Jr.
Seller's Agent in 2012
Joseph Clancy Jr.
Tullish & Clancy
(617) 308-1483
1 in this area
53 Total Sales
Map
Source: MLS Property Information Network (MLS PIN)
MLS Number: 71325861
APN: SBOS-000000-000006-002420-000004
Disclaimer: Certain information contained herein is derived from information provided by parties other than Homes.com. All information provided is deemed reliable, but is not guaranteed to be accurate and should be independently verified.
![]() The property listing data and information, or the Images, set forth herein were provided to MLS Property Information Network, Inc. from third party sources, including sellers, lessors and public records, and were compiled by MLS Property Information Network, Inc. The property listing data and information, and the Images, are for the personal, non-commercial use of consumers having a good faith interest in purchasing or leasing listed properties of the type displayed to them and may not be used for any purpose other than to identify prospective properties which such consumers may have a good faith interest in purchasing or leasing. MLS Property Information Network, Inc. and its subscribers disclaim any and all representations and warranties as to the accuracy of the property listing data and information, or as to the accuracy of any of the Images, set forth herein.
The property listing data and information, or the Images, set forth herein were provided to MLS Property Information Network, Inc. from third party sources, including sellers, lessors and public records, and were compiled by MLS Property Information Network, Inc. The property listing data and information, and the Images, are for the personal, non-commercial use of consumers having a good faith interest in purchasing or leasing listed properties of the type displayed to them and may not be used for any purpose other than to identify prospective properties which such consumers may have a good faith interest in purchasing or leasing. MLS Property Information Network, Inc. and its subscribers disclaim any and all representations and warranties as to the accuracy of the property listing data and information, or as to the accuracy of any of the Images, set forth herein.
Nearby Homes
- 9 Beckler Ave Unit 2
- 11 Beckler Ave
- 689 E Fourth Unit 1
- 707 E 4th St Unit 2
- 603 E 6th St Unit 2
- 615 E 6th St Unit 6
- 562 E 5th St
- 714 E 4th St Unit 3
- 594 E 7th St
- 317 K St
- 614 E 7th St
- 633 E 6th St
- 561 E 6th St
- 183 L St Unit 1
- 658 E 6th St Unit 3
- 569 E 7th St
- 646 E 7th St Unit 1
- 750 E 4th St Unit 1
- 178 L St
- 654 E 7th St Unit 3